Many of you will have used our original Heart Rate Variability Add-On and may be wondering how HRV 2.0 is different. Today, we’ll look at the changes to the user interface.
The HRV 2.0 LabChart Add-On comes with several thoughtful improvements to give you more control over your heart rate variability analysis and interpretation.
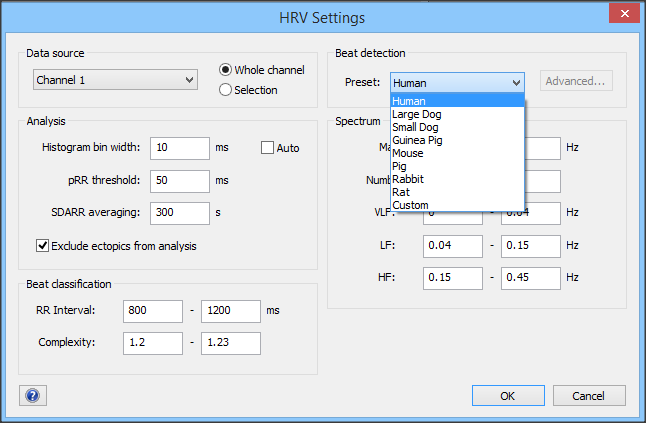
Firstly, you can control all basic settings from a single dialog. We have included presets for humans and several common animal subjects for you to choose from, or you can enter your own.

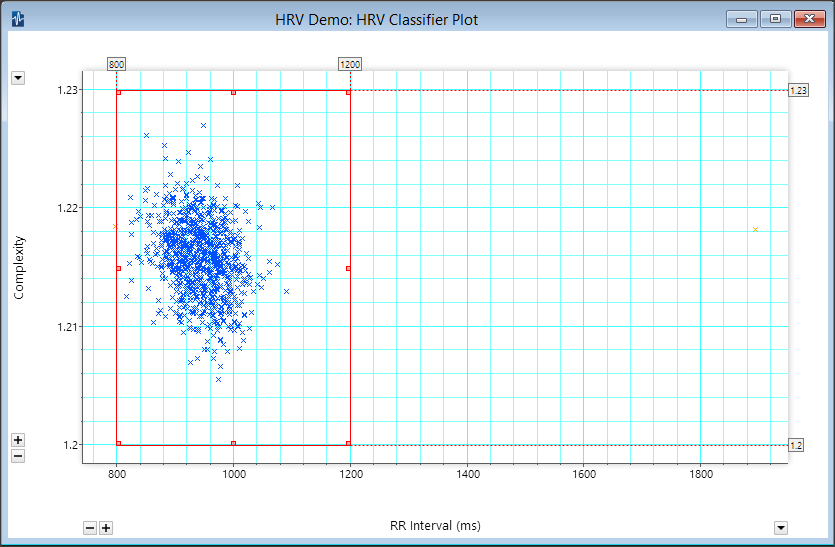
QRS detection and beat placement are automated and classified as either ectopic or normal, defined by the preset or custom setting you've chosen - no need for an artifact category. They are easy to monitor when plotted in the new Beat Classifier View. Undetected beats can be added just by clicking on the waveform and selecting 'Add Beat Marker', and they can be removed just as easily too.

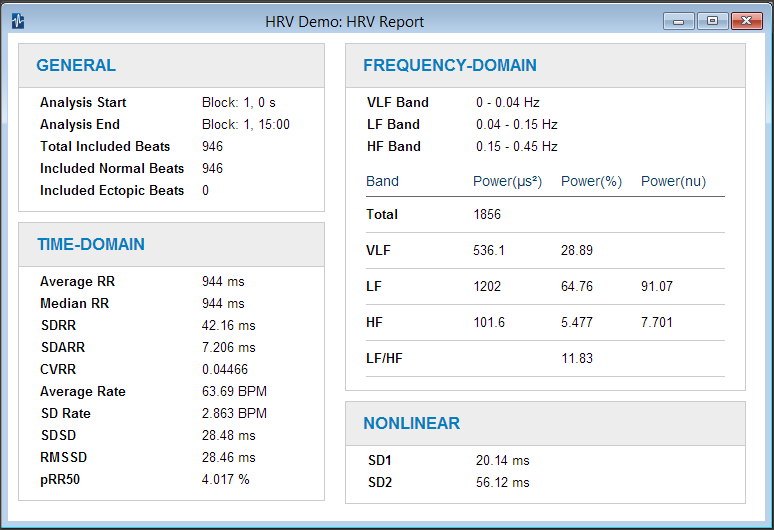
When it comes to reporting, you'll find the report window has had quite a makeover. With a slicker, updated look, results are neatly grouped into General, Time-Domain, Frequency-Domain and Non-Linear sections. By clicking Copy Report, contents can be copied and pasted tidily, maintaining the original formatting. And for cross-platform users, analysis options are exactly the same across both Windows and Mac platforms.

We hope these simple but clever tweaks will improve your HRV experience, and combined with a new spectral analysis algorithm, will speed up your data analysis process. More details coming soon!
Check out HRV 2.0