HRV
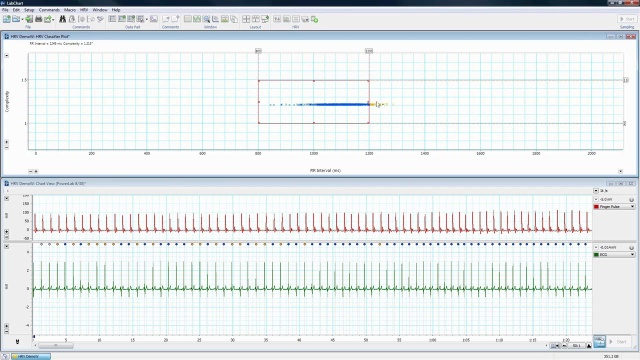
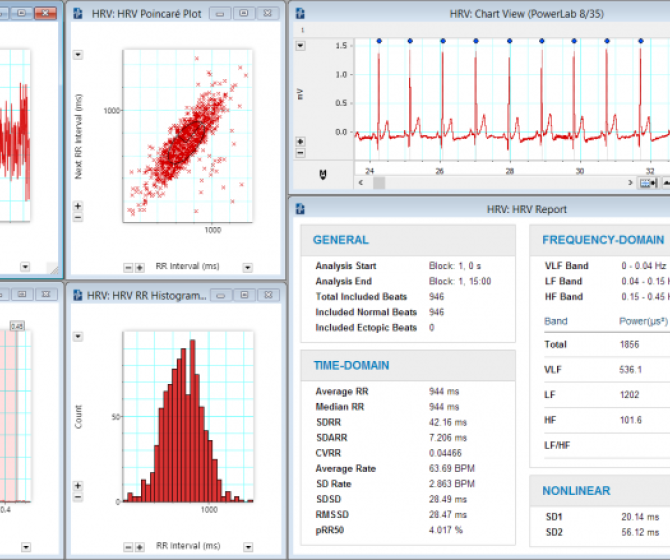
Heart Rate Variability (HRV) is determined by analyzing the time series of beat-to-beat intervals from an electrocardiogram (ECG).
HRV analysis has become one of the most popular methods of ANS evaluation. It is based on the observation that even at rest the duration of RR intervals is not constant but continually fluctuates around the mean value.
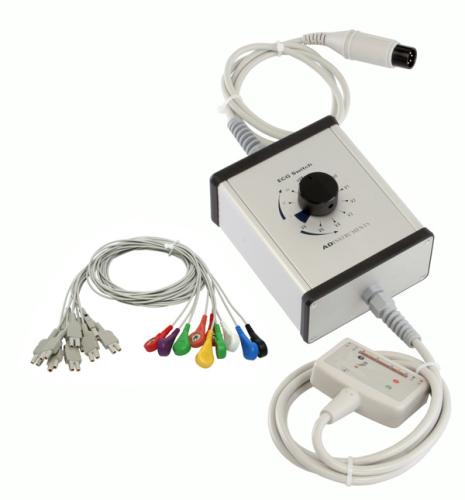
ECG, blood pressure, or arterial pulse recordings can be used to investigate the interplay between sympathetic and parasympathetic nervous systems.
PowerLab and LabChart combine to form a powerful, customizable system to record and analyze heart rate variability (HRV) in animals for your ANS research.
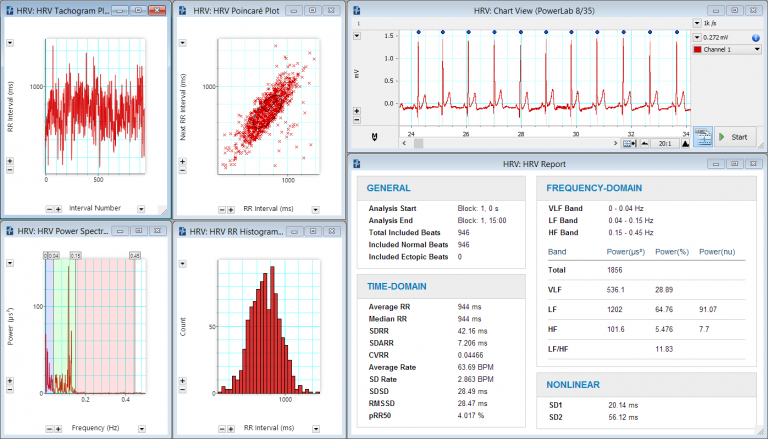
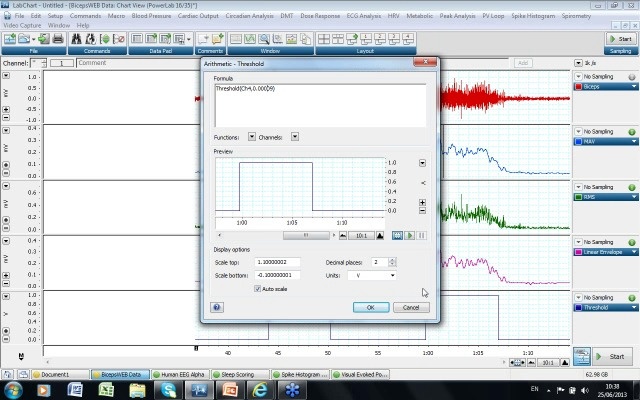
One click analysis
of beat-to-beat
interval variation
Mix and match
products for a custom solution
Combine with
other physiological
recording options
Integrate with
stimulus presentation software
In conjunction with our solutions shown below, any device with an analog output (+/- 10V) can be connected to a PowerLab data acquisition system for synchronization of the event in LabChart, giving you even more flexibility and the ability to integrate your data streams in one place.
All of our hardware is backed by the appropriate safety certification standards. More information on safety standards.
Complete Systems or Kits
The Mikro-Tip BP Foundation System is configured for measuring blood pressure in small through to large animals and provides compatibility with a wide range of Mikro-Tip pressure catheters.
Related Components and Products
Data acquisition and analysis re-imagined. Make unique discoveries with unlimited freedom and flexibility.
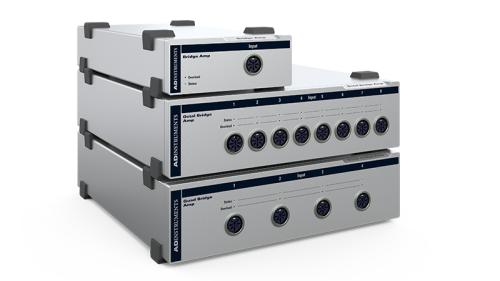
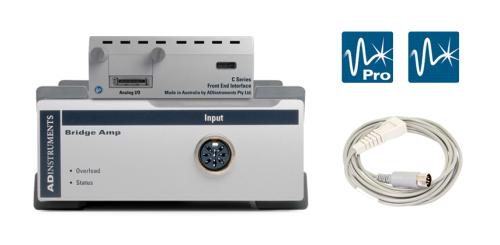
ADInstruments Bridge Amps are single-channel or multi-channel, non-isolated bridge amplifiers designed to allow a C Series Front End Interface or traditional PowerLab to connect to most DC bridge transducers.
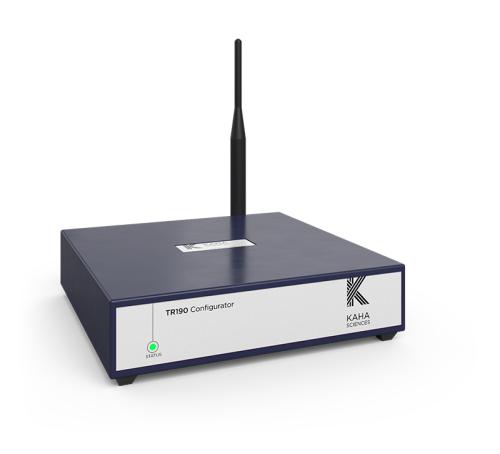
The Configurator System combines both the configurator hardware and ConfigSoft software to allow the wireless configuration and pairing of Kaha rat telemeters and their SmartPads and Kaha mouse telemeters and their tBases.
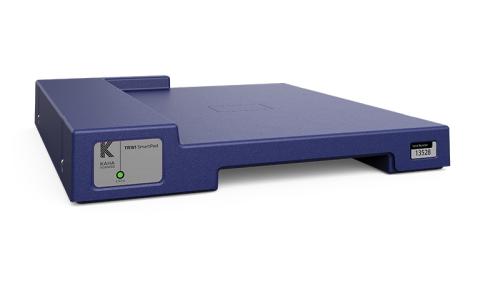
The SmartPad is a receiver and charger in a single unit and will power and receive signals from any Kaha rat telemeter.
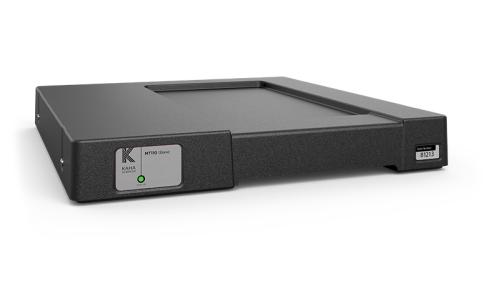
Kaha Sciences mouse telemeters provide the ideal solution for research scientists looking to record high quality wireless biopotential signals (ECG, EEG, or EMG) and index of animal activity in mice over 22 grams.
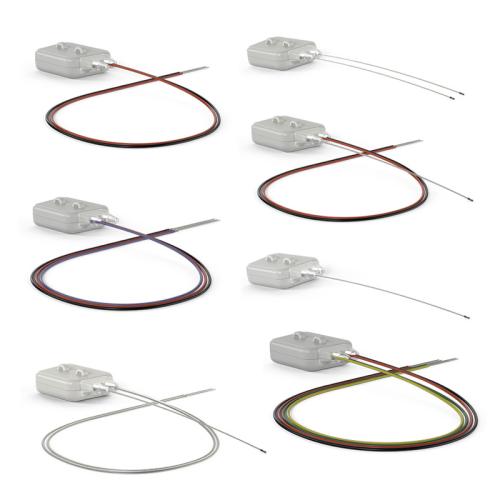
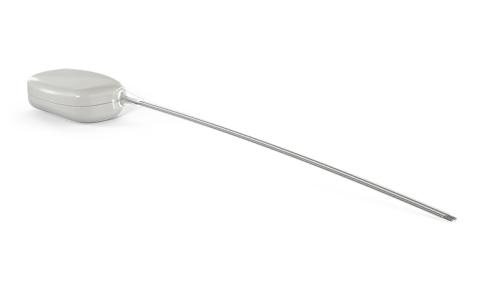
Kaha Sciences rat telemeters provide the ideal solution for research scientists looking to record high quality wireless telemetry signals.
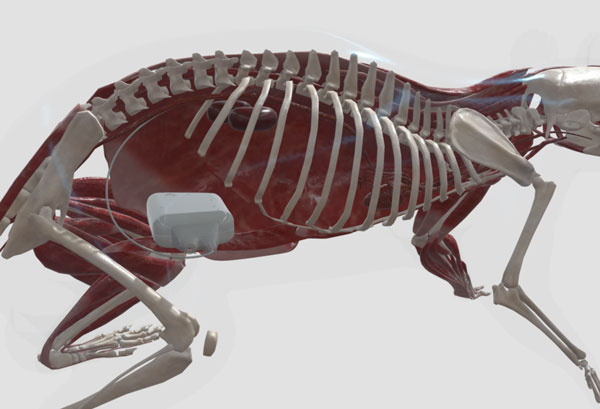
3D Implant Models
Interact with common implantation options
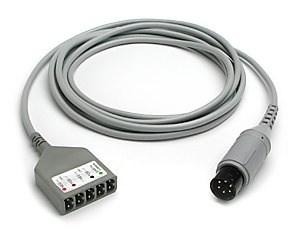
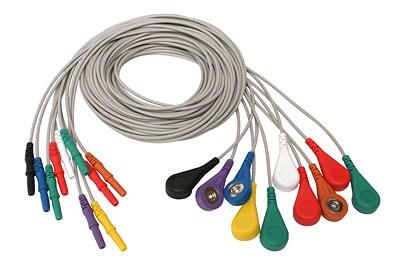
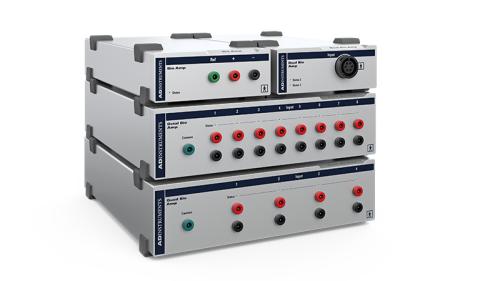
A range of lead wires are available for connection to ADInstruments Bio Amps directly or via respective compatible Bio Amp Cables.

Flexible Data Acquisition
ADInstruments systems provide an integrated solution to advance life science research. With the combination of LabChart or LabChart Lightning analysis software and a PowerLab data acquisition unit, you have the flexibility to collect and synchronize a wide range of signals for analysis. We also offer a range of LabChart compatible solutions able to stream directly in LabChart.
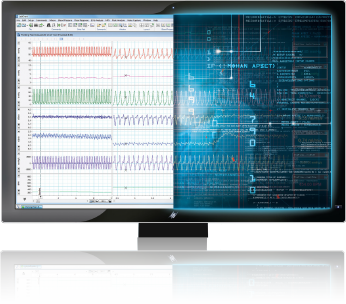
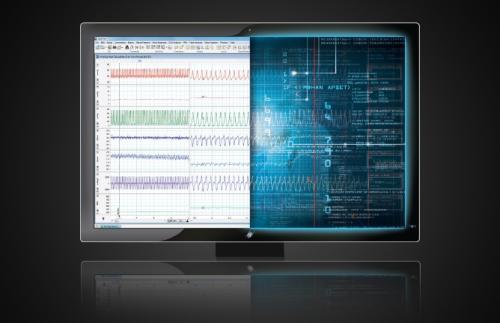
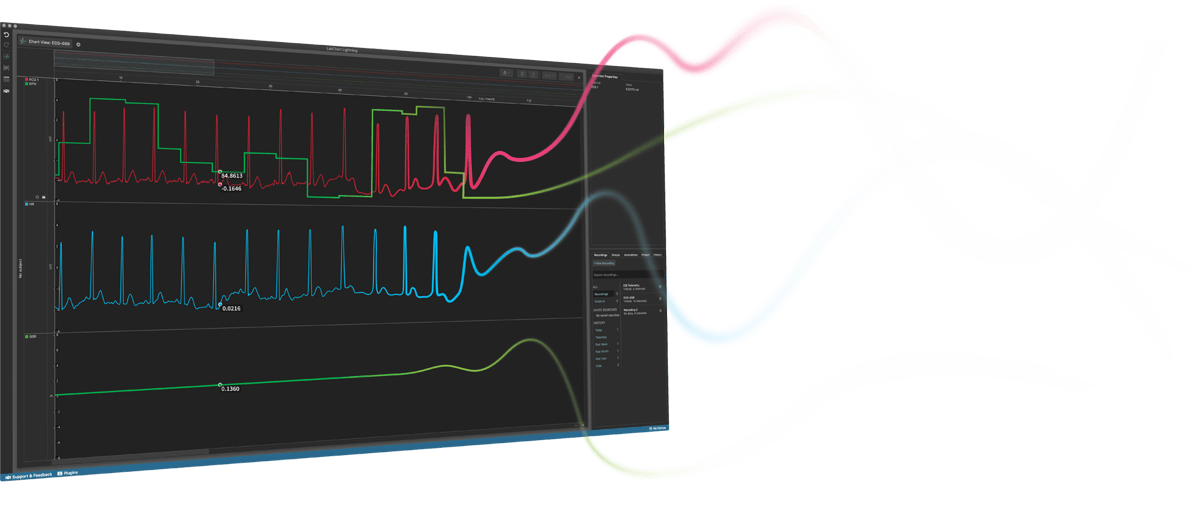
LabChart data analysis software creates a platform for all of your recording devices to work together, allowing you to acquire biological signals from multiple sources simultaneously and apply advanced calculations and plots as your experiment unfolds.
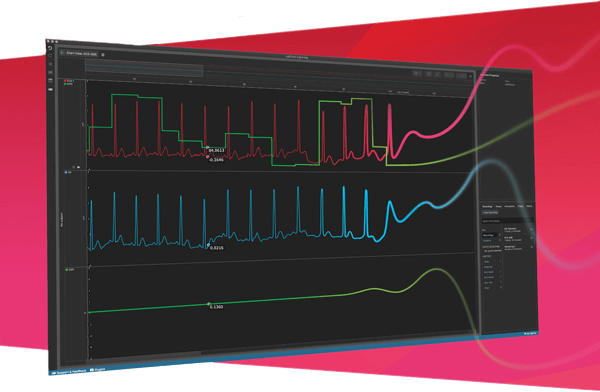
Data acquisition and analysis re-imagined. Make unique discoveries with unlimited freedom and flexibility.
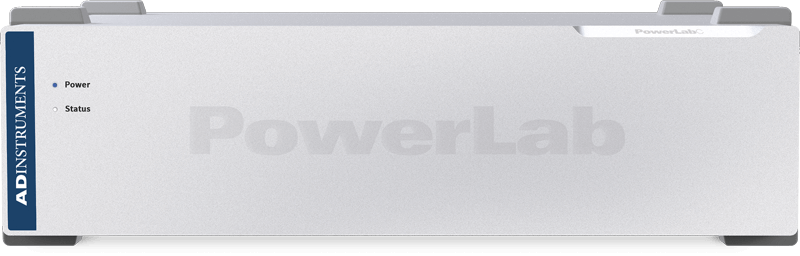
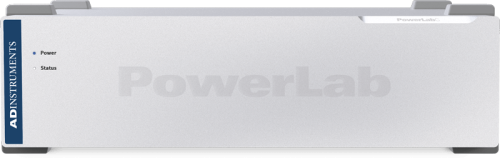
High-performance data acquisition hardware designed for life science research. PowerLab is engineered for precise, consistent, reliable data acquisition, giving you the reproducible data you need while meeting the strictest international safety standards.
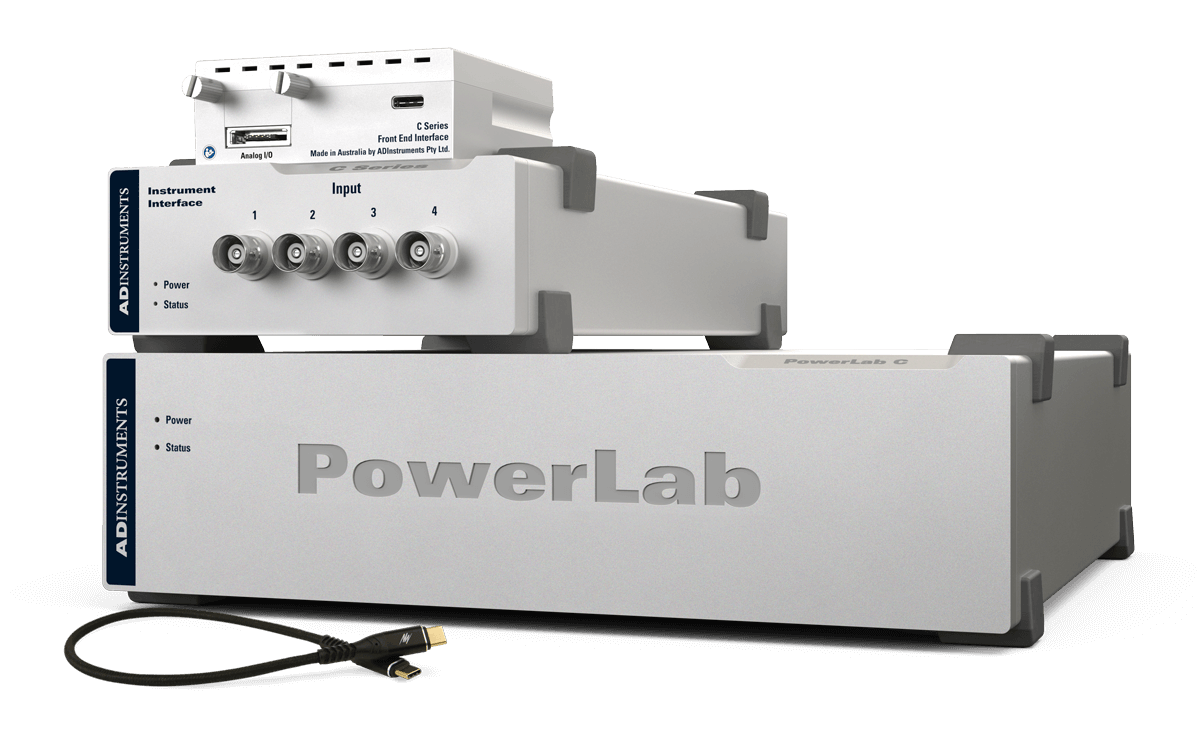
A modular data acquisition foundation system that provides unparalleled flexibility for researchers looking to invest in customizable, reliable solutions for both now, and in the future.
All your analysis in one place
LabChart software is designed specifically for life science data and provides up to 32 channels for data display and analysis options that are powerful and easy to use. With auto-recognition of ADI and LabChart Compatible hardware, multi-window views, one touch recording, simultaneous recording from multiple devices, specialized preconfigured settings, easy sharing options and an interface that can be customized to show only the features you want to use.
Features and Add-Ons
Additional acquisition and analysis options to support your HRV analysis:

Data acquisition and analysis re-imagined.
Make unique discoveries with unlimited freedom and flexibility.