The Graph panel can be used to create graphs from data stored in Spreadsheet or Table panels. You can choose from a variety of graph types and apply curve fits to your data.
To add a Graph panel, select PANELS from the footer, then Basic from the PANELS menu as shown below:
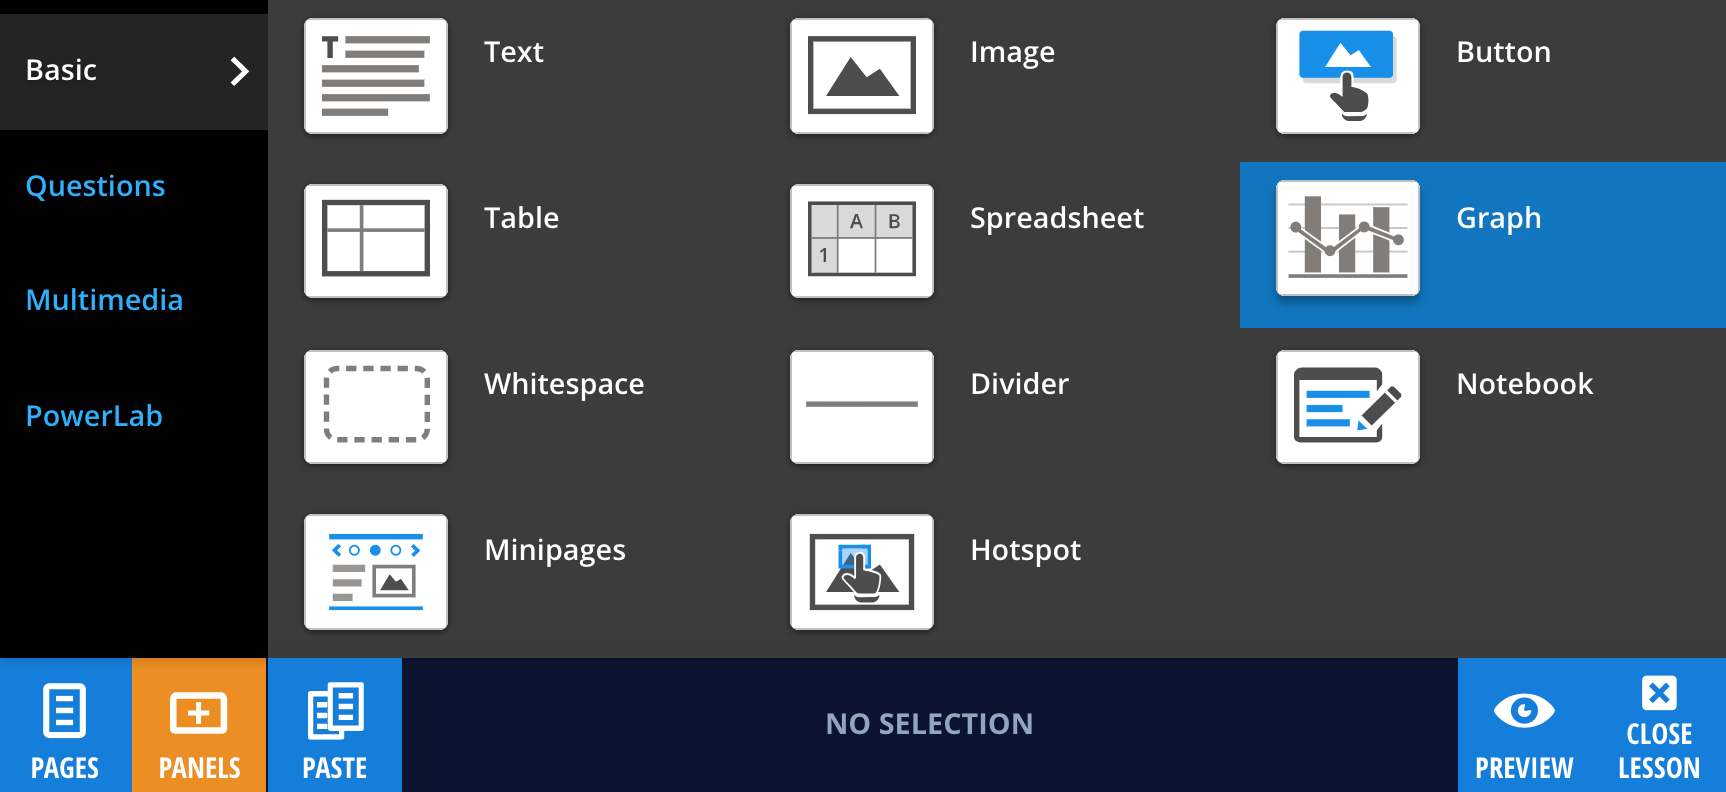
Creating your Graph
Drag and drop the Graph icon to the desired location on the page. An empty Graph panel will appear. To add data to your graph, select the Graph panel, then Select Data, then choose which panel you wish to link to the graph.
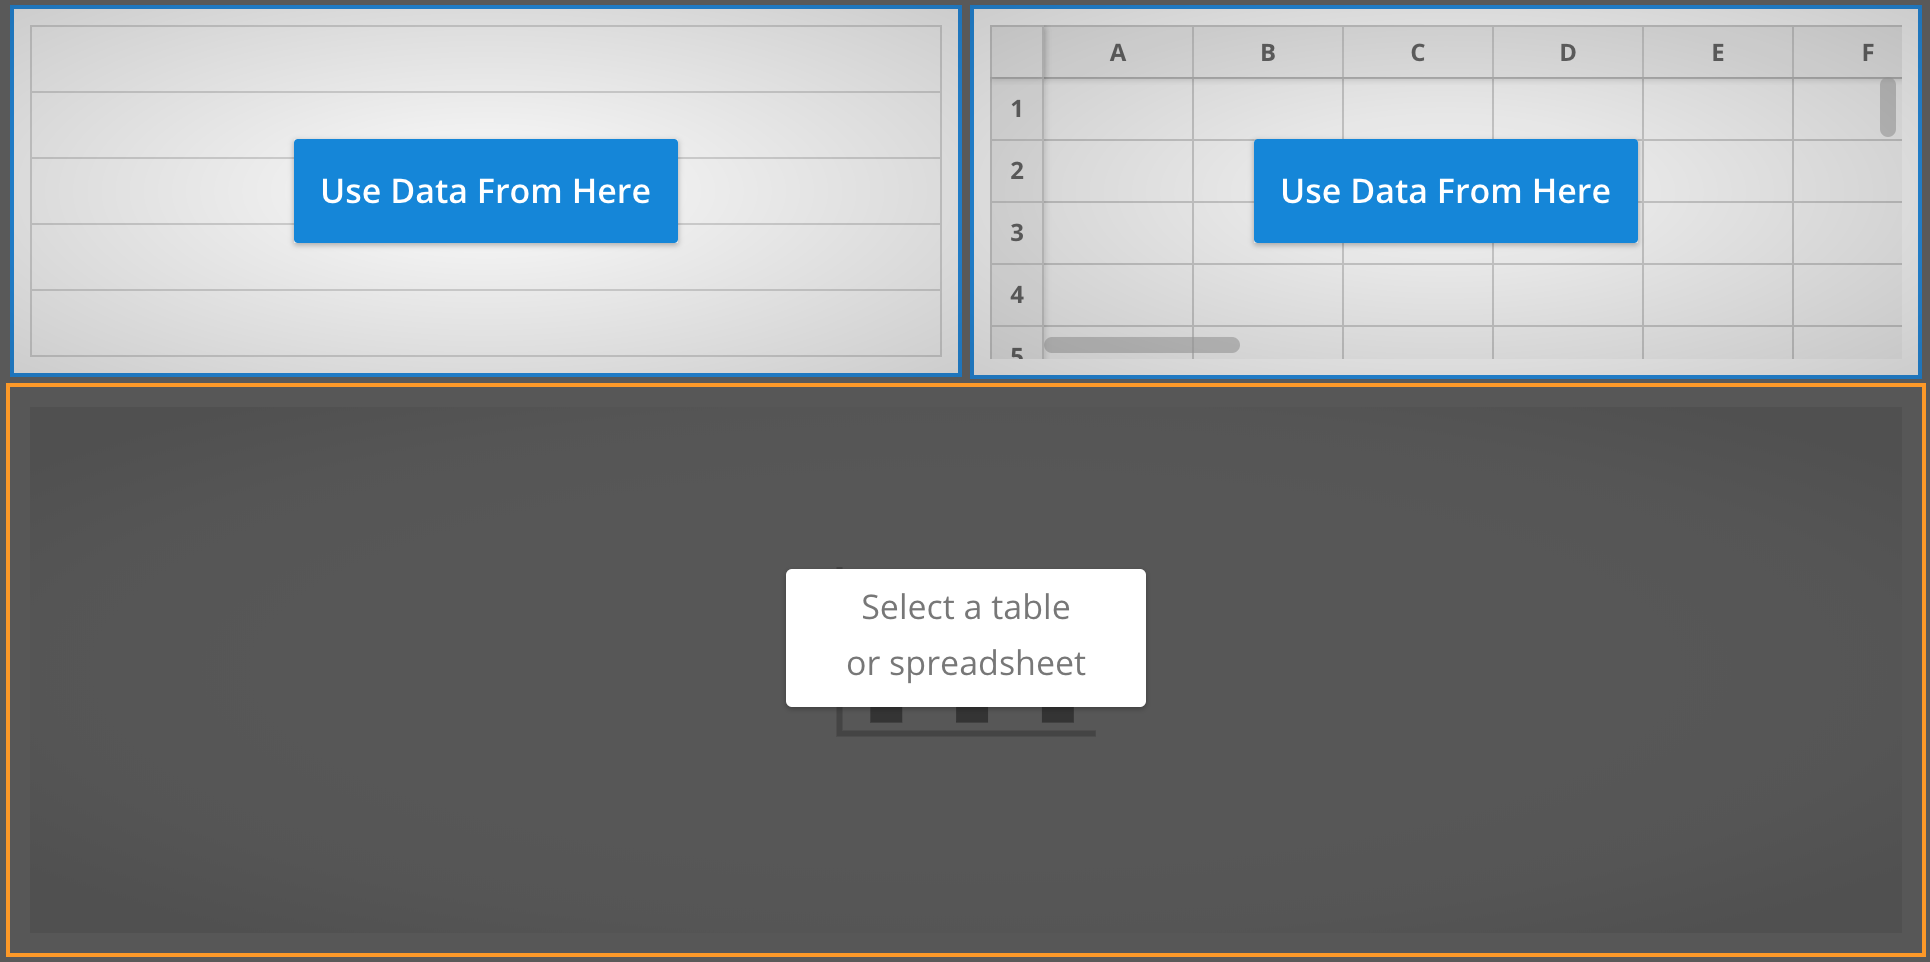
Note: Graphs require a Spreadsheet or Table panel on the same page to act as the data source. When the graph panel is selected, a dashed border will appear around the Table or Spreadsheet panel the graph is linked to. If there are no Spreadsheets or Tables on the same page, a graph cannot be created. Graph panels can be also linked to Table Question and Spreadsheet Question panels.
You can change which panel the Graph is linked to by pressing the Select Data icon beside the panel edit button .
To create and customize your graph, select Edit then Edit Graph.
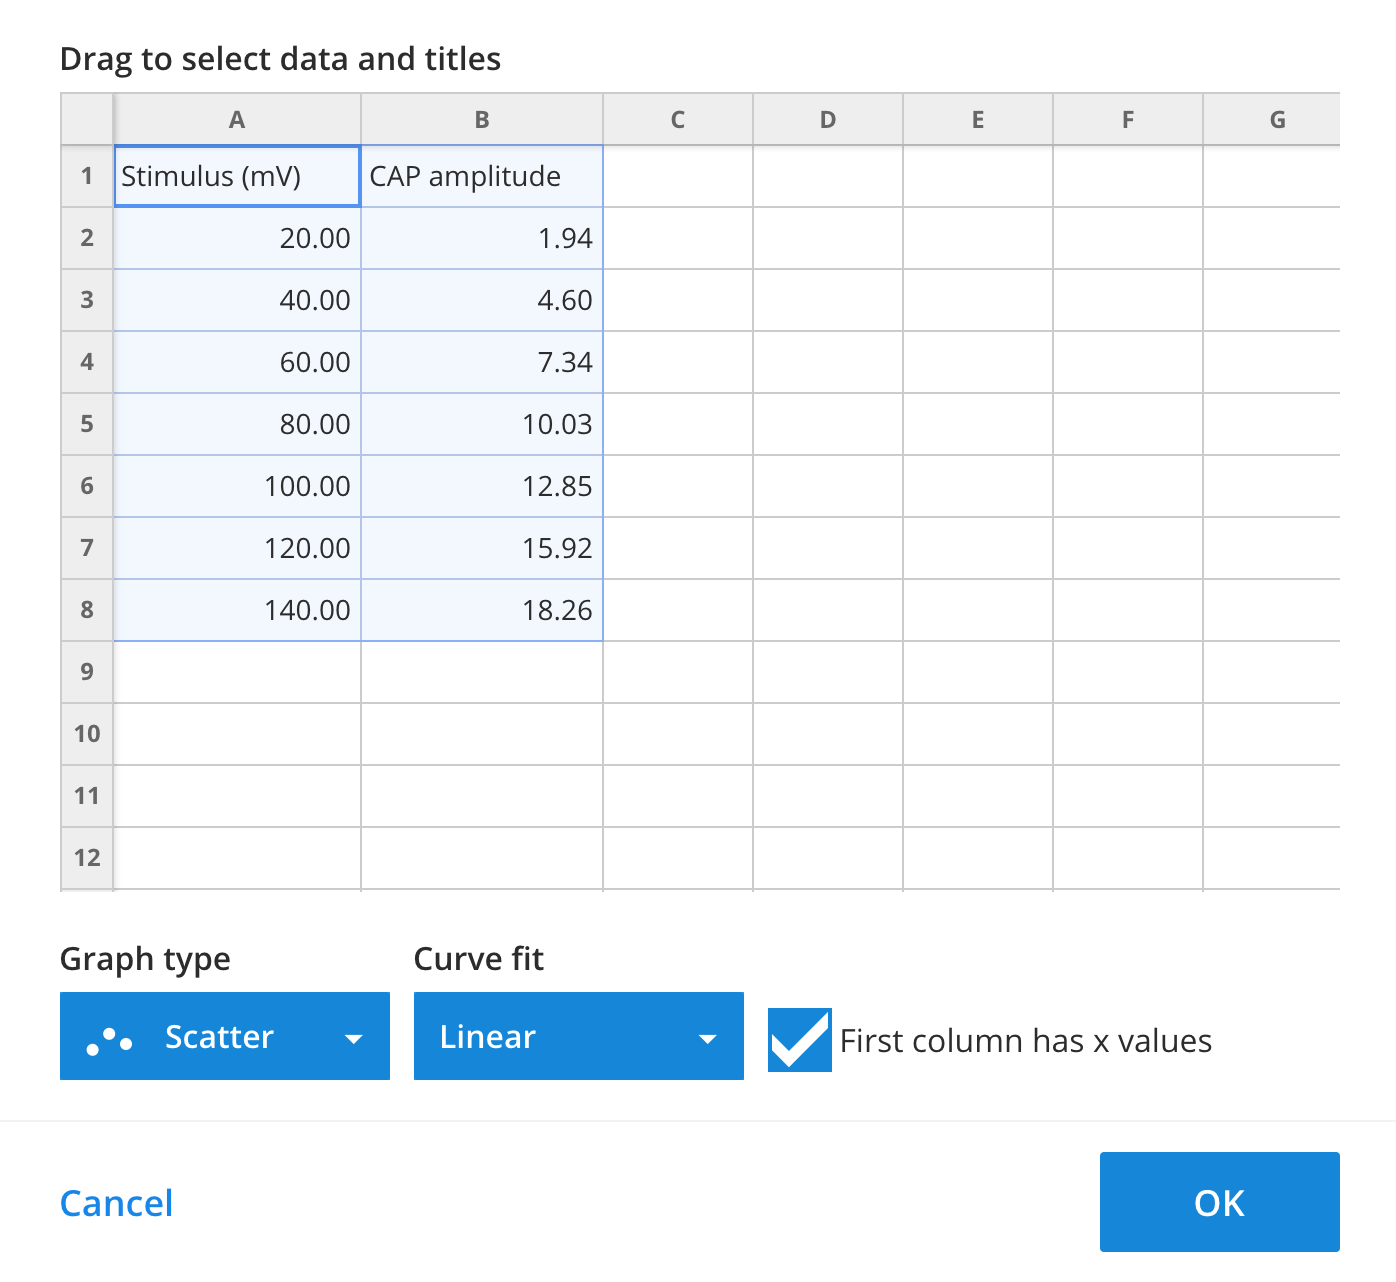
From this dialog, drag and select the cells you want the graph panel to read. You can also click on a row or column header to select an entire row or column.
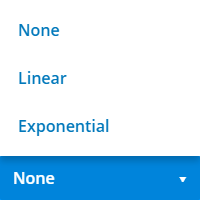
Next, select the type of graph that you wish to create. Choose between Bar, Line and Scatter graph types. You can also add a Linear or Exponential curve fit to the graph. 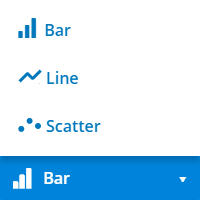
After making a data selection and choosing your graphing preferences, select OK. If there is data in the linked Table or Spreadsheet, your graph will appear.
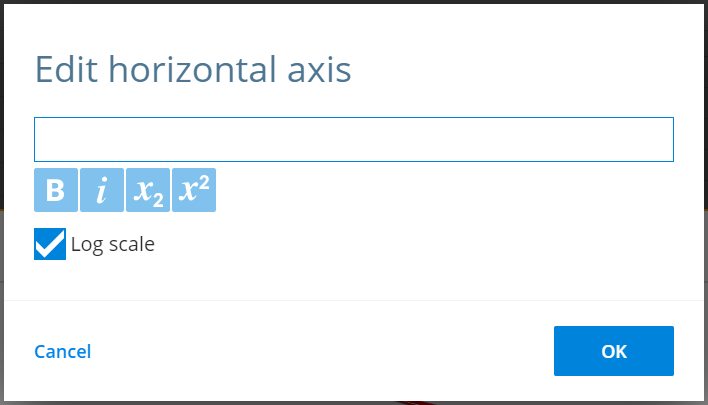
Title and axis labels can be edited by selecting the blue pencil icon beside the label. A dialog will appear where you can edit the text before selecting OK to save the change.
Curve fit equations display beneath the x-axis label.
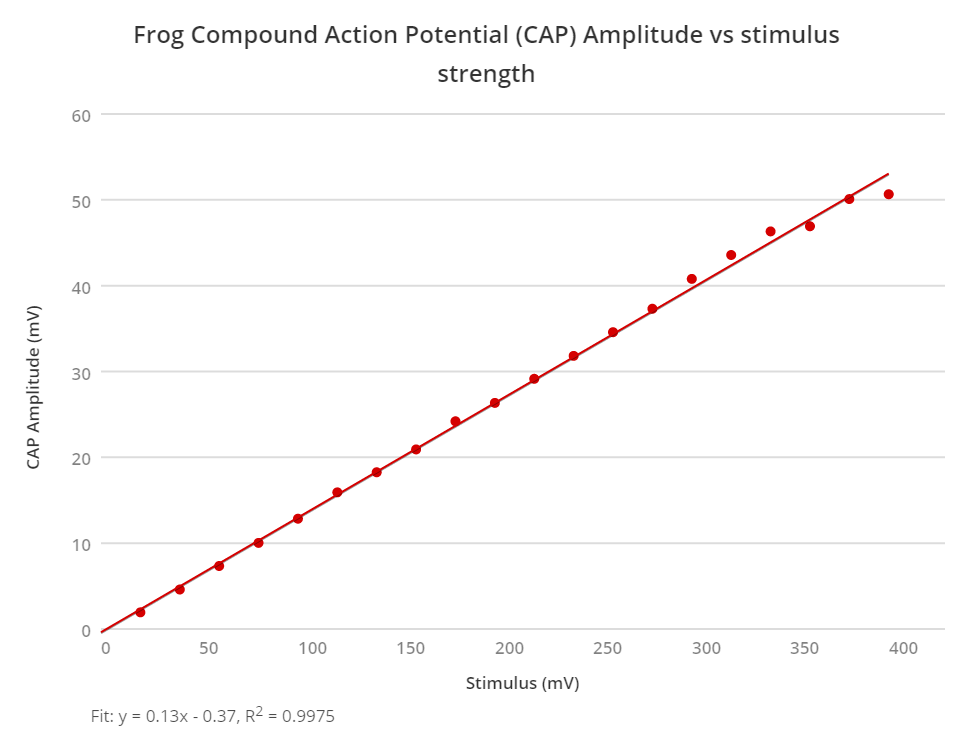
If it is a Line or Scatter graph, the dialog boxes associated with the axis labels will have an additional ‘Log scale’ checkbox. This checkbox changes the axis to a logarithmic scale. This setting is good for graphs that have data with a large range of values.
