Perform this simple experiment to validate your Optogenetics Biopotential Telemeter, without surgical implantation.
This experiment is designed to:
- Demonstrate the capacity of the Optogenetics Biopotential Telemeter to activate neurons expressing ChR2 opsins.
- Demonstrate the similarity of natural physiological and optogenetically stimulated responses.
- Provide a method of validating your Optogenetics Telemeter, which can be performed in an anesthetized animal with no surgical implantation required.
The raw EEG example data file can be downloaded here, for comparison with your own experiments.
This experiment was performed in partnership with Aston University as part of our Knowledge Transfer Partnership. Thank you to Dr. Stuart Greenhill of Aston University for designing this experiment, and to Phil Griffiths, our European Research Sales Manager here at ADInstruments.
Introduction:
Rodents use their whiskers to navigate their surrounding environment. Each whisker is organized in a defined map, which is conserved and represented in the somatosensory cortex in the brain. Distinct regions of the somatosensory cortex respond to the movement of a single whisker, with each region roughly cylindrical and extending through the six cortical layers. This gives rise to the name barrel cortex (Figure 1).
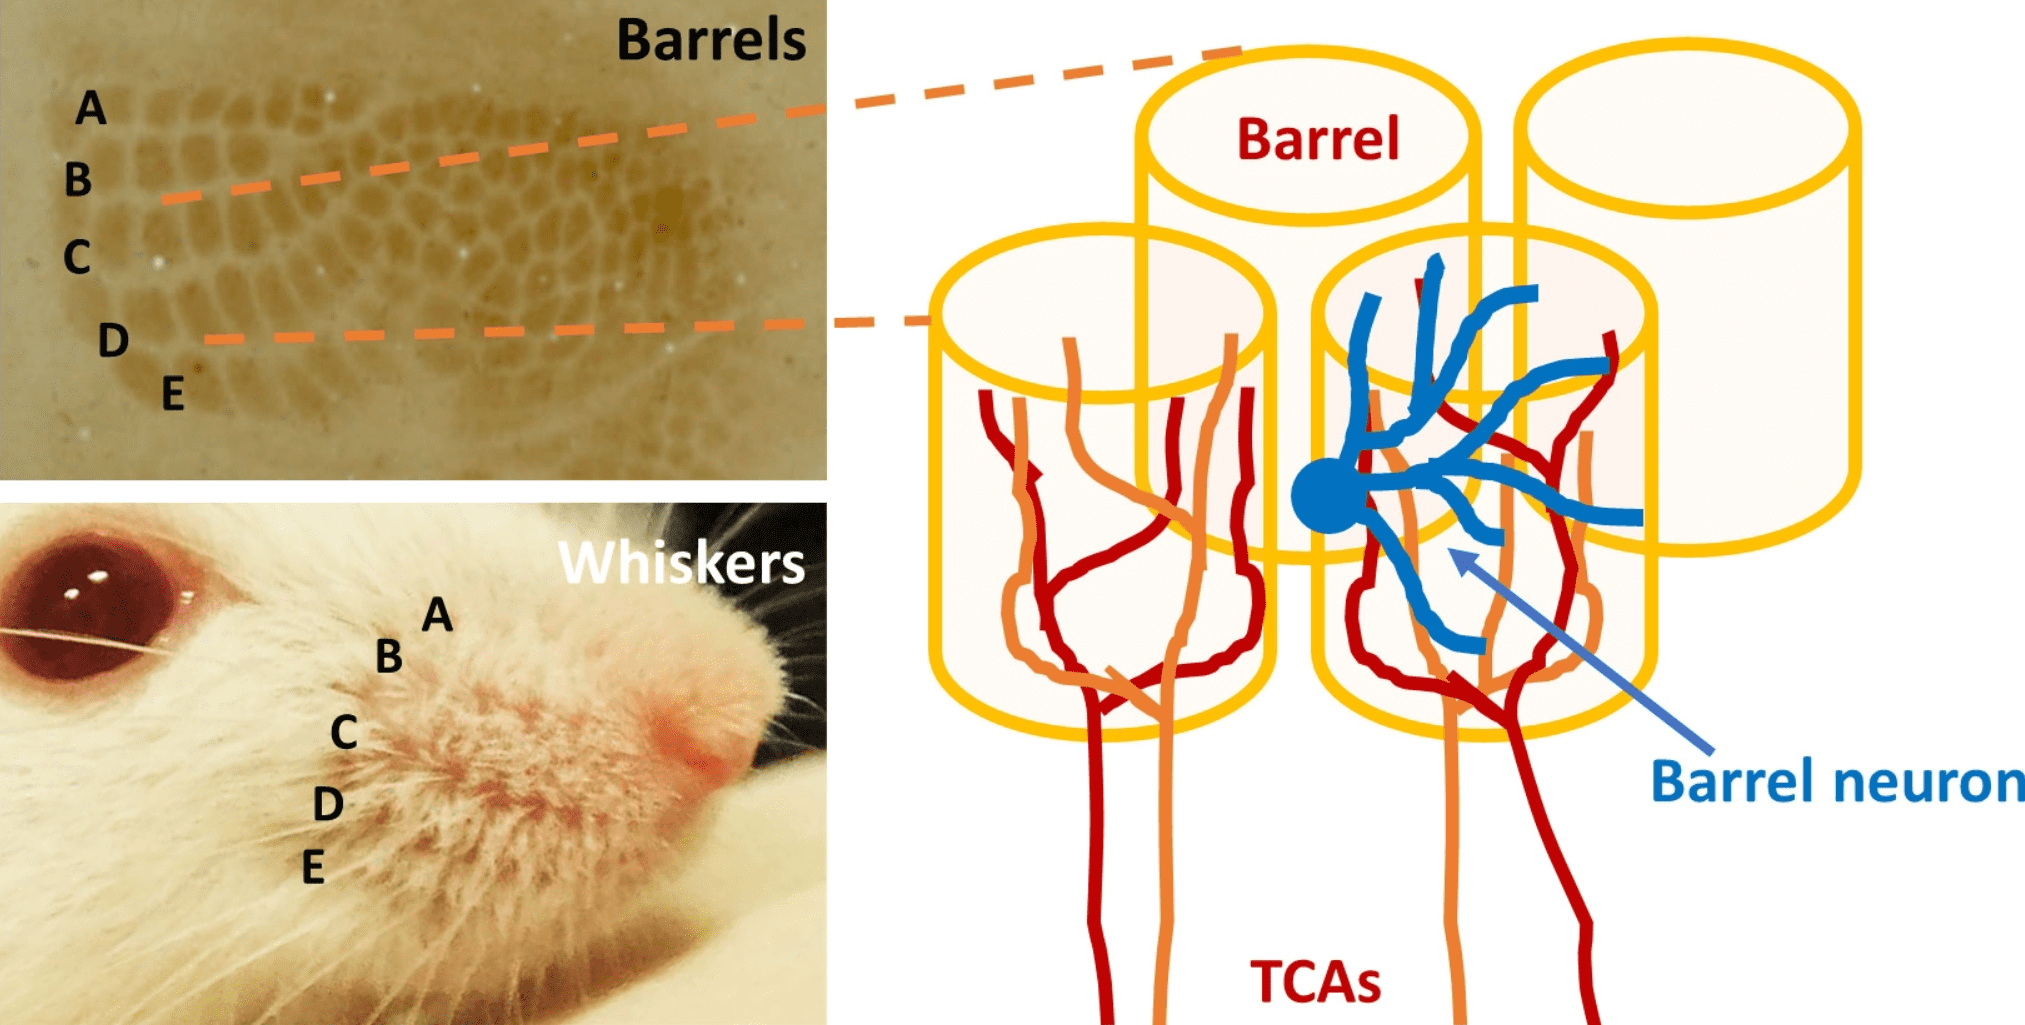
Figure 1: This figure (Iwasato 2020) illustrates the whisker-barrel circuits and dendritic orientation of barrel neurons.
Manipulation of a single whisker evokes a neuronal response in the corresponding barrel field in the somatosensory cortex. Moving all whiskers simultaneously evokes responses from a large population of somatosensory neurons. This population spike is easily detected through EEG recording via the biopotential leads of the telemeter. This can be performed while the animal is anesthetized. The rat barrel cortex presents an easily accessible and manipulatable brain region. Manual manipulation of the whiskers produces a defined physiological response, which can be mimicked with optogenetic stimulation.
The somatosensory cortex is on the surface of the brain, making it easily accessible for viral injection of ChR2 opsins. This proximity of opsin expression to the surface of the brain allows for straightforward stimulation from the telemeter LED. Successful stimulation of the whole barrel cortex will mimic the population spike observed when the whiskers are manually manipulated.
For more information about this protocol, please contact your technical support person »
Methods:
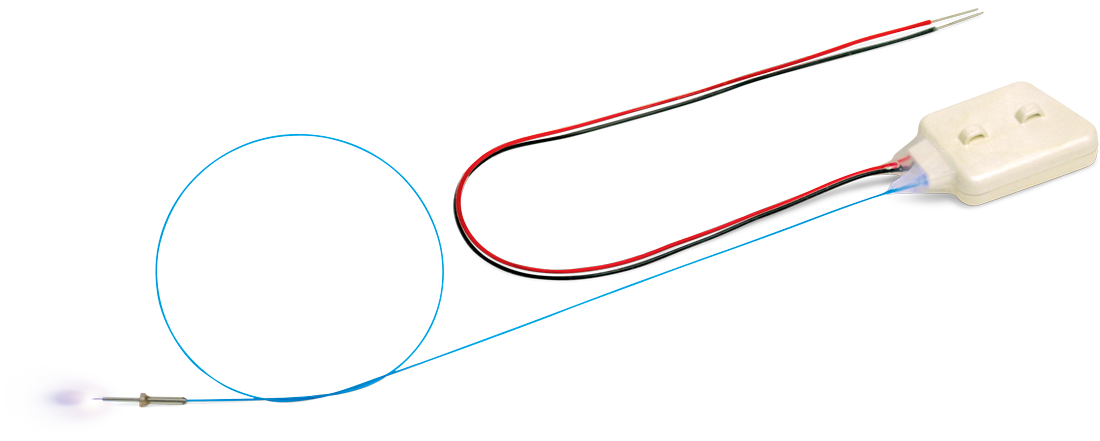
Fourteen days prior to this optogenetics experiment, your model animal will need to be injected with a viral vector. This allows for enough time to begin centrally expressing opsin proteins. In this case, a Wistar rat was anesthetized with isoflurane (1.5% at 1.8 L/min), and injected with AAV8-syn-ChR2 (473nm max excitation wavelength, Addgene, USA), targeted to the barrel cortex region of the somatosensory cortex.
On the day of the experiment, the rodent was anesthetized with isoflurane (1.5% at 1.8 L/min) and positioned in a stereotaxic frame. A craniotomy was drilled over the S1 barrel cortex and a depth electrode, connected to the +ve lead of the biopotential telemeter, was advanced 300 µm into the brain. The negative lead of the biopotential telemeter was attached to a skull screw positioned over the contralateral S1 barrel cortex.
The optic fibre of the telemeter was positioned on the surface of the S1 barrel cortex. Stimulation was delivered (50 ms pulse width, 1 Hz, 100% Light Intensity) to create optogenetically-evoked potentials.
To observe the physiological response to manual whisker manipulation, a wooden swab stick can be used to move the whiskers.
Results:
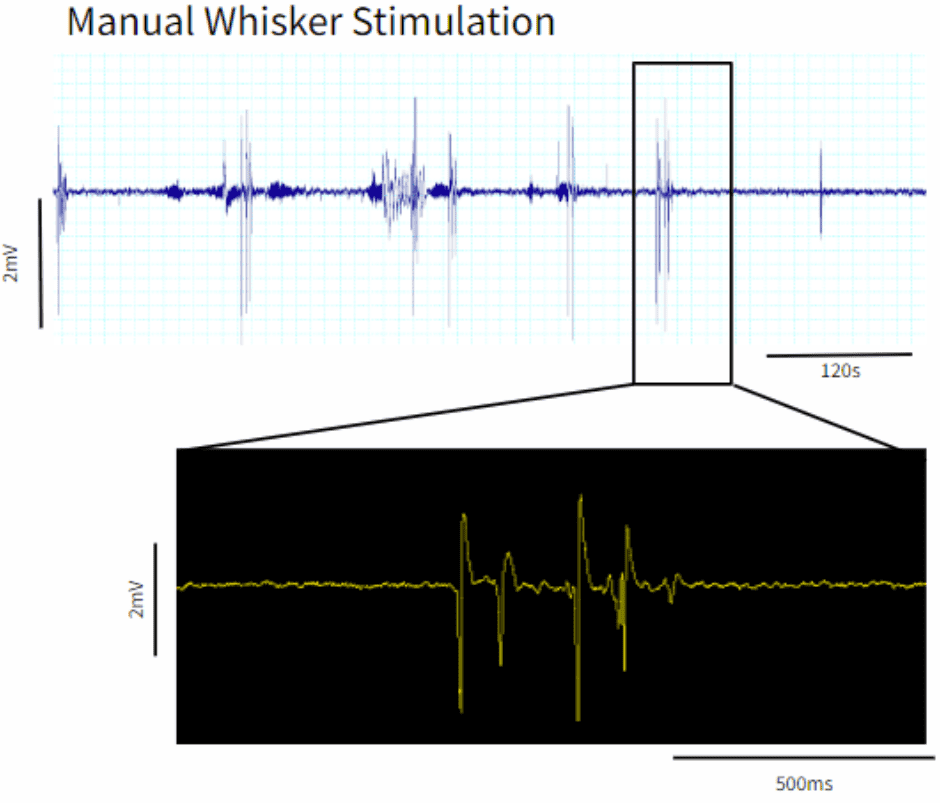
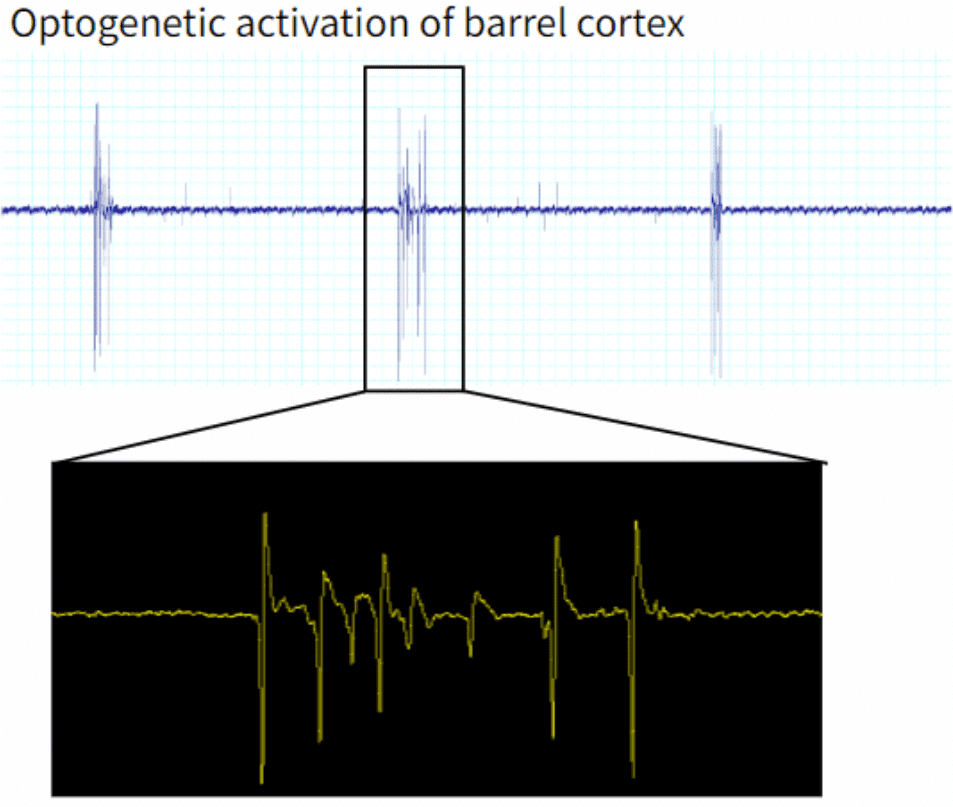
Figure 2: A comparison of the evoked potentials in the S1 barrel cortex, from manual manipulation of the whiskers and optogenetic stimulation.
You should see successful optogenetic activation of the S1 barrel cortex by the Optogenetics Biopotential Telemeter. When manually manipulating the whiskers, physiologically-evoked potentials are produced (Figure 2). The same trains of population spikes are also recorded following optogenetic stimulation at the cortical surface.
In this example, optogenetically-evoked responses occurred roughly 18 seconds apart. This is likely due to two factors: one, the effects of anesthesia on the rodent, and two, the lack of optimization of stimulation parameters. These result in burst-suppression, whereby the optogenetic stimulation causes a maximal firing response, and neuronal populations require recovery time in order to fire again. Please take the time to optimize your stimulation parameters.
For a complete walk-through of the surgical process for telemeter implantation, watch our 1.5 hour Surgical Instructional video with Dr. Conor Underwood here:
Surgical Instruction: Placement of Optogenetics Telemeter within the Rat Brain »
Additional Resources:
-
Iwasato, Takuji. “In Vivo Imaging of Neural Circuit Formation in the Neonatal Mouse Barrel Cortex.” Development, Growth & Differentiation, vol. 62, no. 7–8, Wiley, Oct. 2020, pp. 476–86. https://doi.org/10.1111/dgd.12693.