Stimulator

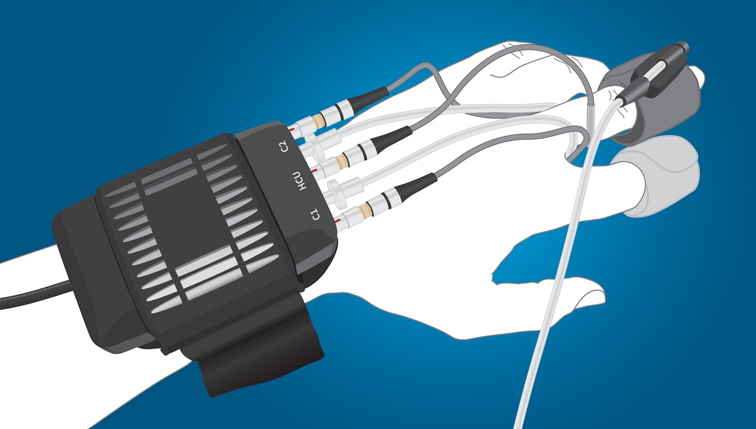
You can now use your Stimulator hardware with LabChart Lightning. This allows you to generate stimulus waveforms using the PowerLab analog outputs, Stimulus Isolators and even multiple Stimulus Isolators connected through C Series Front-End Interfaces.
LabChart Lightning lets you create multiple stimulus protocols for your project. You can easily define calibration phases separate from your experiment phases or even set up different stimulus configurations to stimulate together.
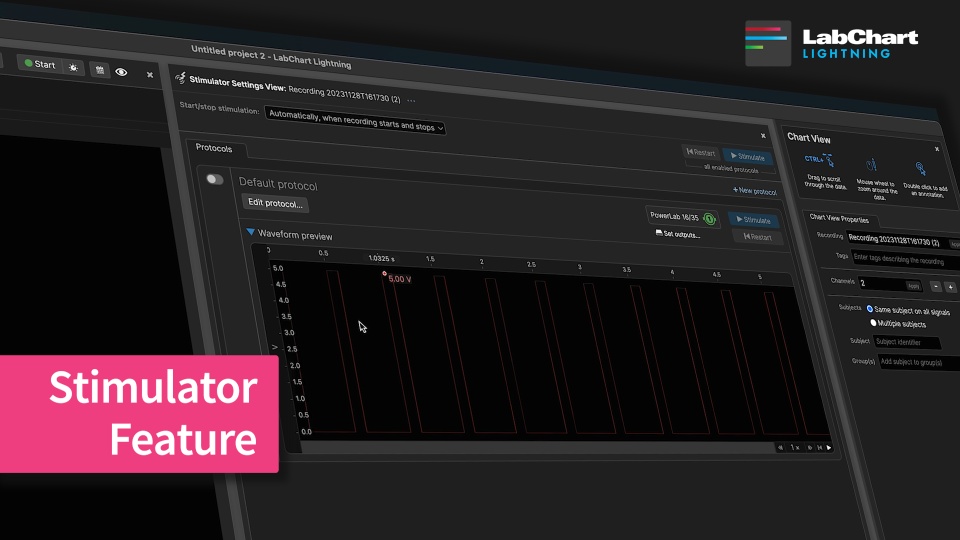
Click the Stimulator icon on the left toolbar to access the Stimulator view:

In this View, you can:
- Create new stimulus protocols from scratch or duplicate one to build on a configuration.
- Preview your stimulus waveforms in the Protocols list and the Protocol Configuration panel.
- Control how you want your stimulus to start.
- Define which hardware outputs you want to generate your stimulus output from.
- Define the shape of the stimulus waveform you want to output.
- Control all enabled protocols together or independently of each other, depending on what you need.

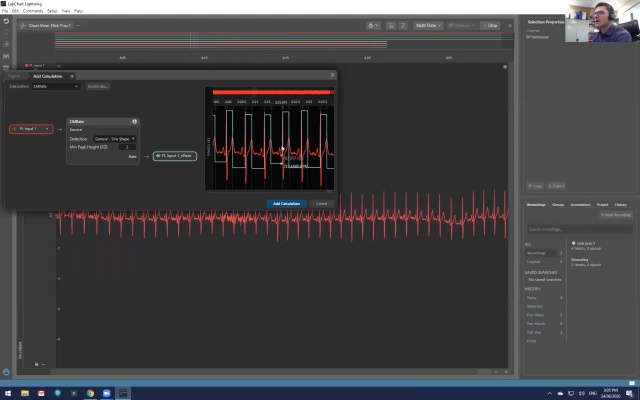
Lightning Stimulator supports basic LabChart 8 waveform types such as:
- Pulse,
- Sinewave,
- Triangle etc.
In Lightning Stimulator, we've also added new built-in support for typical pulse burst applications such as:
- Height Delta,
- Width Delta,
- Frequency Delta, and
- S1-S2 Delta.

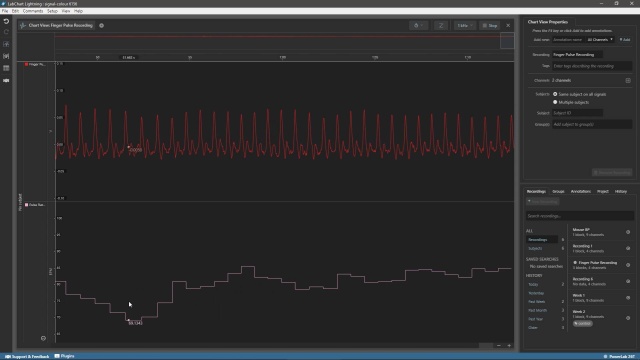
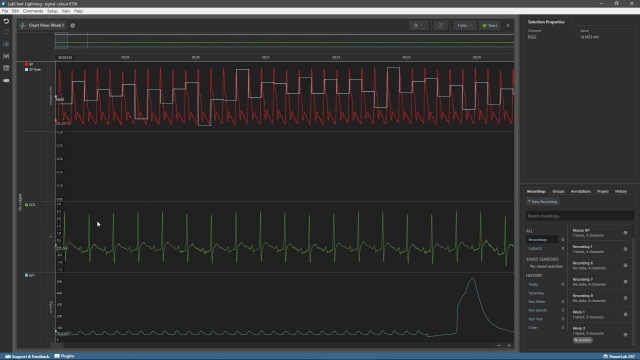
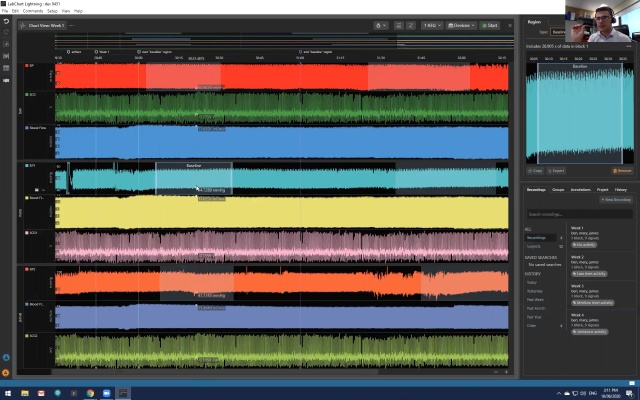
You can now turn the recording inputs on/off individually in the signal settings dialog. The recorded signal settings can be accessed from either the Setup menu, or clicking the signal icon next to the devices popup.

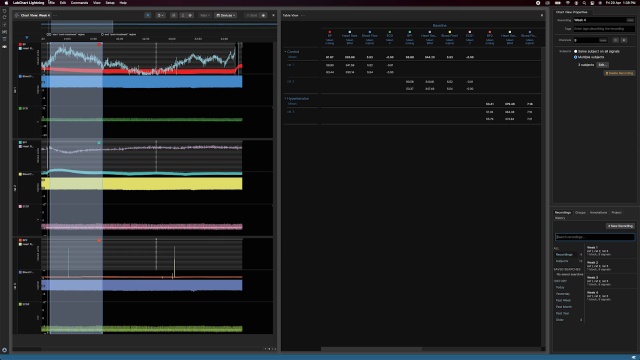
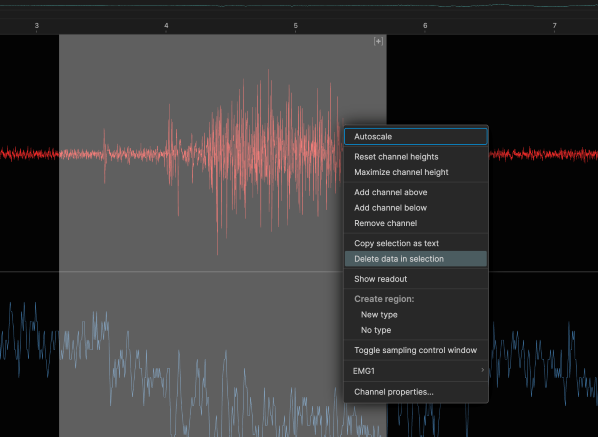
LabChart Lightning now allows you to export selected data to the HDF5 file format. HDF5 files can be opened using a broad range of programs, including MatLab, R-Studio and Python.
HDF5 is a file format that allows large amounts of data to be organized in a hierarchical manner, allowing for the creation of groups and datasets within a file. This structure enables the organization of data in a way that reflects a filesytem with groups and datasets being analagous to directories and files. See the HDF Group Website for more details.
To export to HDF5, select the data in the recording you would like to export, then bring up the exporting dialog by clicking on the export button in the selection panel or use the sequence File>Export>Export selection... from the menu bar. Make sure the HDF5 file format is used in the export selection dialog box (it is set as the default option). Once the save button has been pressed, a modal box will appear informing the user of the progress of the data exporting.

Changes
- Performing a delta start action across all signals and then closing and reopening the project multiple times closes the project successfully.
- Input options apply correctly for C Series Instrument & Front End Interfaces in regions that use commas for decimal separators.
- Lightning will correctly load for users who have an apostrophe in their username.
- Readouts of calculated signals loaded from .lclset files will display data without requiring a reload.
- To support using the desired PowerLab Stimulator outputs when using multiple non-C Series PowerLabs or a mix of non-C Series PowerLabs and C Series PowerLabs, you can now change the Primary device (or devices if C Series) in the Recording Devices popup by clicking on the Primary/Secondary device icons.
- C Series Instrument Interfaces no longer have a small DC offset up to 50uV on certain units.
- Spikes at the beginning of blocks no longer occur with C Series Instrument Interfaces.
- Improved power handling on PowerLab C ports.
New Known Issues
- There is currently no undo/redo support for Stimulator changes.
- Data recovery in the event of a crash will not recover Stimulator settings.
- Stimulator user interface may not show device errors that occur while sampling.