Welcome to the LabChart Lightning advanced custom calculations demonstration video. In this video we will cover creating calculations with multiple inputs/outputs, using parameters and saving your calculations for reuse.
To learn the basics of the custom calculations feature, please watch An Introduction to Custom Calculations.
Multiple inputs and outputs
Custom calculations can have multiple inputs and outputs.
Starting with the custom calculation shown below (figure 1), we can add a second output by dragging an output node from the function library to the canvas. The new output can be placed anywhere you like but in general, outputs should be on the right side of the canvas area.
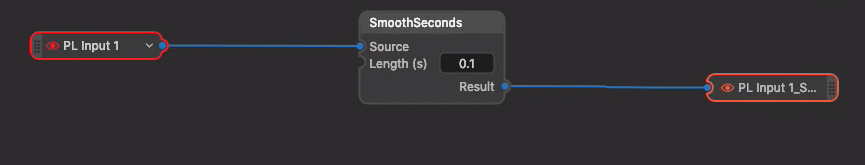
Figure 1: Smoothing custom calculation.
Lets drag a second SmoothSeconds node to the canvas and connect it to the PL Input 1 input and the second Output node. We set the length to 0.1 for the first SmoothSeconds node to 0.2 for the second SmoothSeconds node. This custom calculation now produces two outputs (figure 2).
The preview will show three signals - the source or input signal and two smoothed signals.
Custom calculations may contain as many outputs as you need. Each output node produces a corresponding calculated signal.
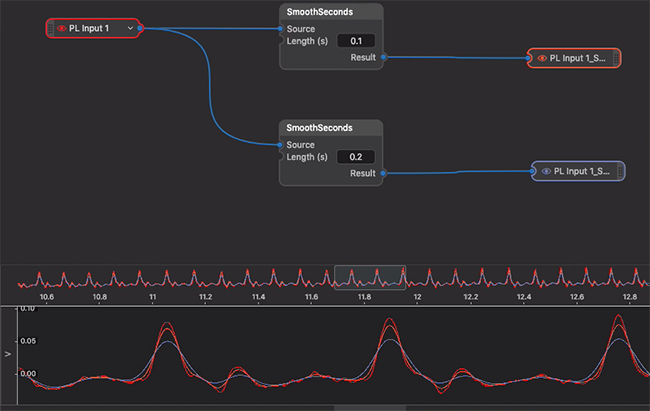
Figure 2: Custom calculation with multiple outputs.
We will now make a custom calculation with two inputs and two outputs. Using the data shown below (figure 3), we add a custom calculation by clicking on one of the signals in Chart View and clicking on the add calculated signal button.
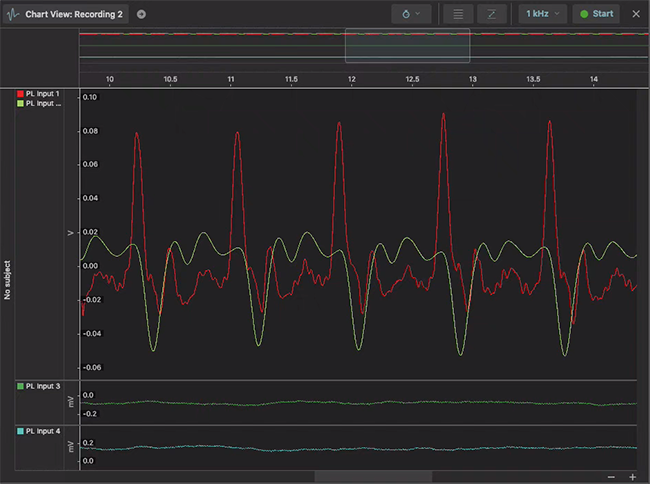
Figure 3: The starting point for multiple input and output calculation.
The custom calculation will output the difference between the two signals and the sum of the two signals. Although this may not necessarily be a calculation you would create, it does illustrate the flexibility of the custom calculation system.
Using calculation parameters
We start with a single input and output and add an additional input and output. The signal that is the sum of the two inputs is created by dragging an Add function node to the canvas with the two input nodes as its sources.
The difference between the input signals is calculated by using a Subtract function with the two inputs as its sources.
The Add function node is connected to the top output node, and the Subtract function node is connected to the bottom output node. There will now be four signals shown in the preview. We can remove some of the clutter in the preview by clicking on the eye icon in both of the input nodes.
Click on the Add Calculation button to apply the calculation. The two new output signals will now be visible in Chart View. An autoscale may be required to view the signals.
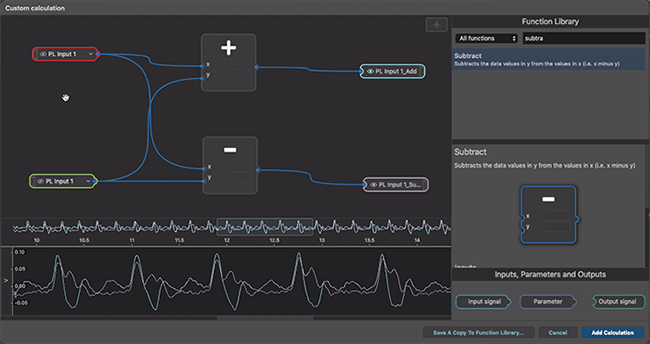
Figure 4: The finished multiple input and output calculation.
Saving calculations for reuse
Many times we will want to reuse custom calculations across different recordings in a project. Lightning allows Custom Calculations to be saved for reuse across an entire project. Once saved, they can be used as many times as needed quickly and easily without the need to redefine them.
Calculation parameters add an extra level of flexibility to this reuse pattern by allowing saved calculations to accept inputs via node input fields.
To demonstrate these two technologies, we’ll start with a previous example where we created a custom calculation that created two outputs with differing degrees of signal smoothing (see figure 5).
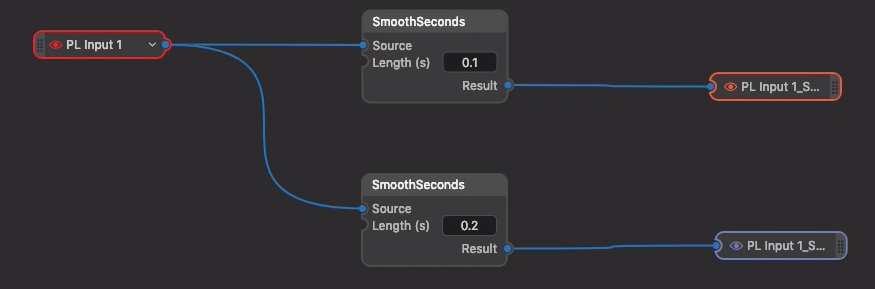
Figure 5: The MultiSmooth custom calculation.
We start by dragging a parameter node to the canvas. A selected parameter node can be configured by clicking on the cog (settings) button. A parameter can have a name, a description, a type (e.g. numeric), and a range of valid values. If you specify these, they will form part of the documentation for the custom calculation when it is saved.
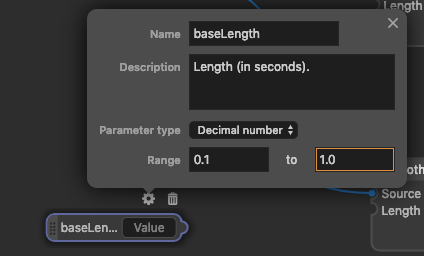
Figure 6: Configuration options for a parameter node.
Once the parameter has had a value specified, it can be connected to the Length inputs for both of the SmoothSeconds nodes (figure 7). Note that the internal Length (the number contained in the input field) is hidden when the parameter nodes are connected.
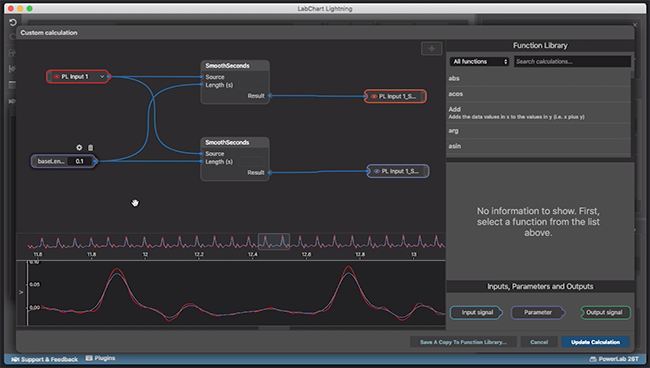
Figure 7: The connected parameter node.
With the parameter node connected, both SmoothSeconds nodes are using the same value for Length. We drag a multiply node to the canvas between the parameter node and the bottom SmoothSeconds node. The parameter value is now doubled for the bottom SmoothSeconds node.
When the value in the parameter node is changed, the bottom SmoothSeconds node always uses double the value.
To save this calculation for reuse, click on the Save a Copy To Function Library button at the bottom right of the custom calculation dialog. A unique name must be given for the calculation. This is how it will be found in the function library and simple calculation popup menu.
In the example below, the calculation is named MultiSmooth. While the description is optional, it is often a good idea to provide one as it will be used to form documentation for the calculation.
Once the Save To Library button is clicked, the calculation is available to be used in all recordings in the project.
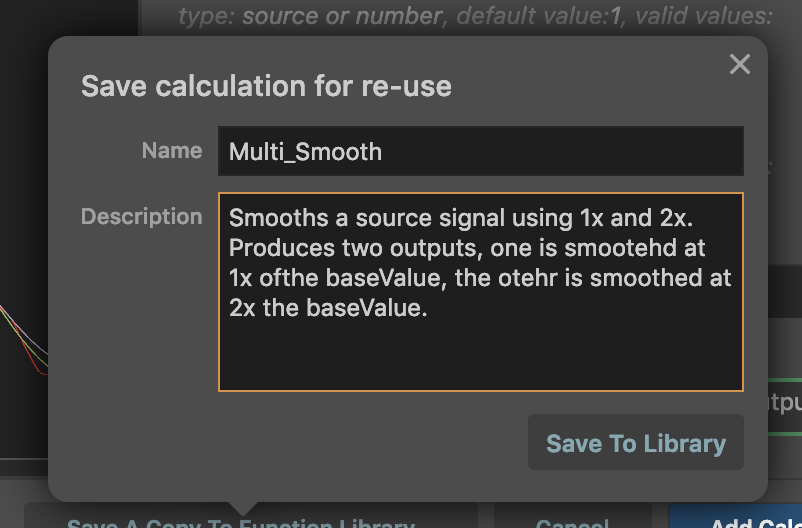
Figure 8: Saving the custom calculation to the Function Library.
To reuse the saved calculation, select a signal and click on the Add Calculated Signal button. From the calculation popup menu, look in the Custom calculations section for the MultiSmooth calculation (figure 9,10).
Documentation available on your saved custom calculation can be viewed by clicking on the information button at the top of the node.
Note also that the saved function can be used in other custom calculations. It can be found by typing a partial or complete name into the function library search field (figure 11).
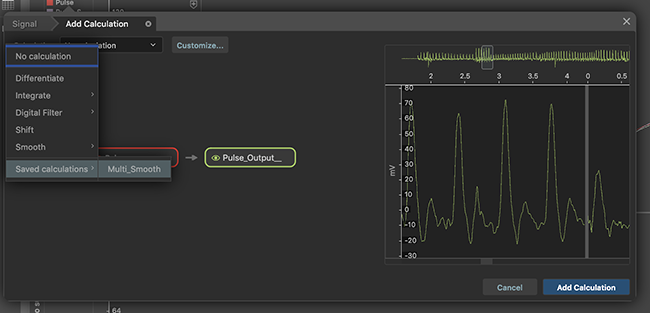
Figure 9: Reusing the saved calculation in the simple calculation interface.
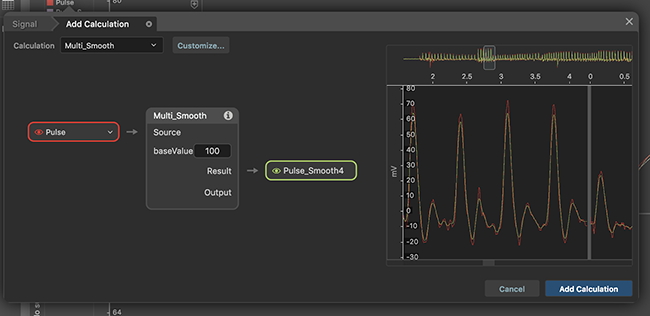
Figure 10: Saved calculation displayed in the simple calculation interface.
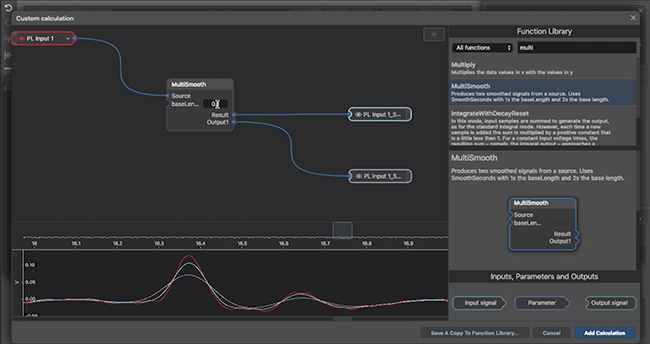
Figure 11: Reusing the saved calculation in the custom calculation interface.
If you have any questions not covered in this video or our other support material, please feel free to contact your nearest support representative - we’d be happy to help!
Enjoy!
The LabChart Team