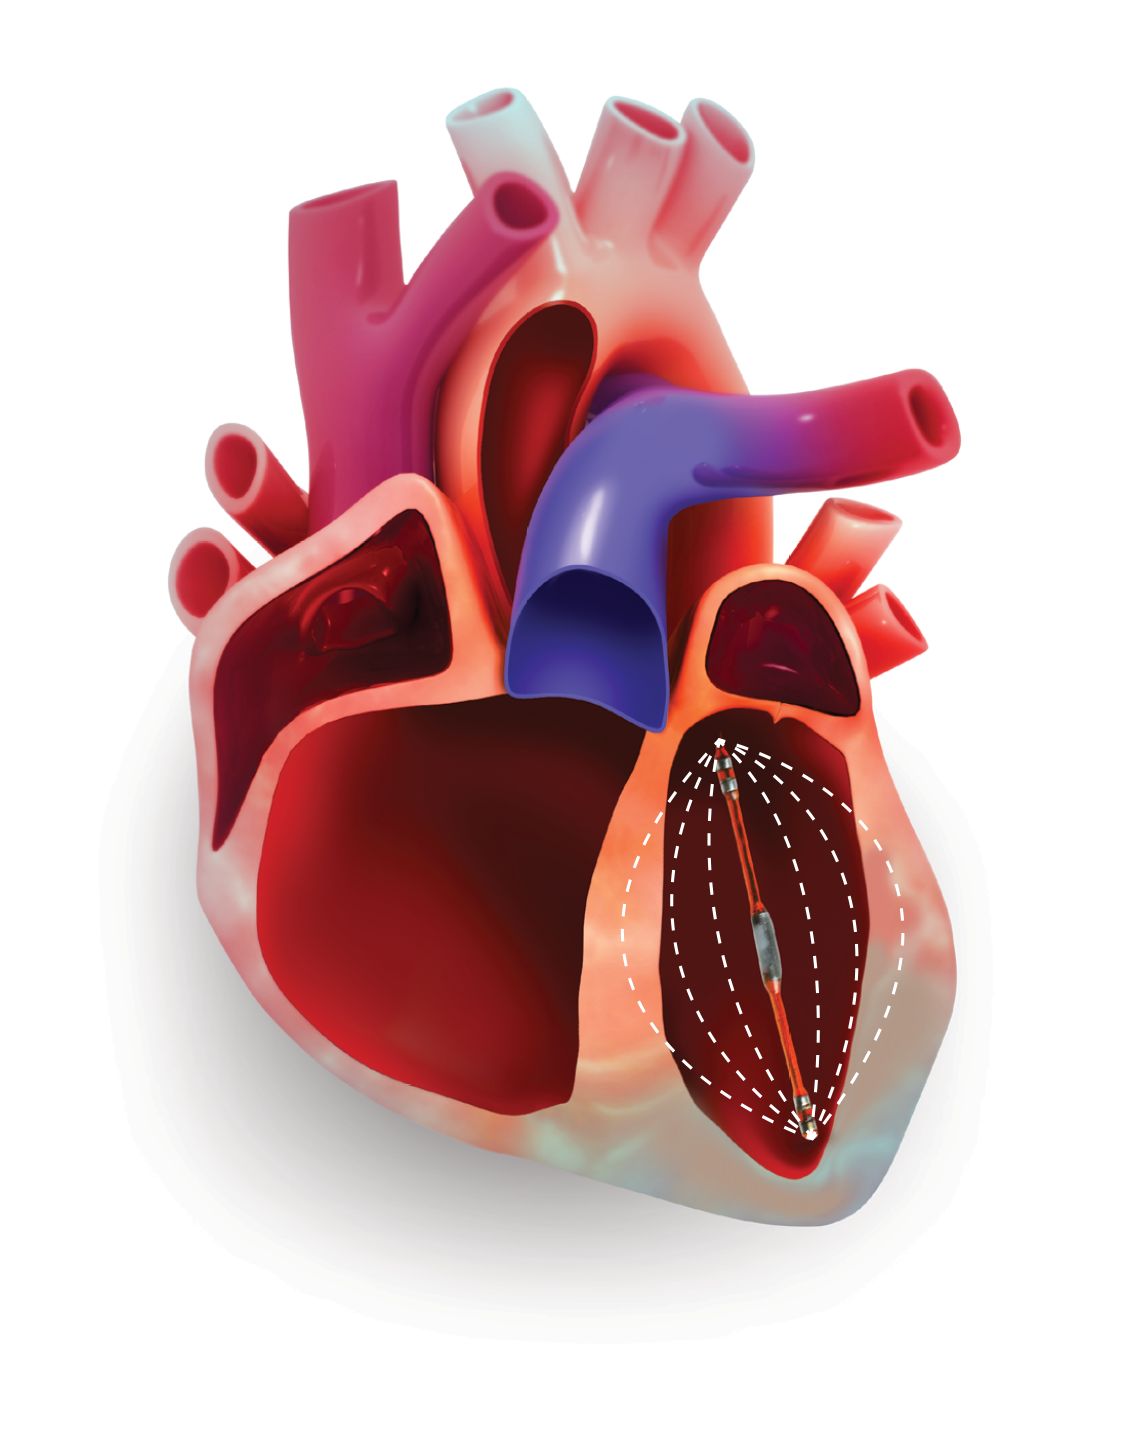
Pressure-Volume (PV) Loops are the gold standard for measuring direct, real-time cardiac function. There are two technologies available for doing PV loop studies, admittance and conductance.
Both systems call for calibration procedures that can be technically challenging or expensive to complete, driving many researchers to avoid these procedures and use estimates instead.
For users of admittance technology, avoiding calibration by using estimates has now become the recommended approach by the manufacturer to arriving at volume calibrated data.
In this article we’ll explore these common shortcuts in calibration, and demonstrate how failing to perform the recommended calibration procedures can produce inaccurate results in both admittance and conductance PV systems.
Key Points
- Not following the recommended calibration procedures can lead to wrong data and false results - in both admittance and conductance systems
- Using estimates assumes all animals to be identical and excludes for biological variation
- By using a predetermined estimate of SV as you reference across a data set, you are eliminating any possibility of using SV as a parameter for comparisons between groups.
- Choosing to use a provided S/E value for a particular heart-type can artificially pre-determine a difference in volume outcome.
Download PDF version of article
Overview
Why is Volume Calibration Necessary?
In order to accurately report on certain volume-derived measures like stroke volume (SV) and end systolic volume (ESV), both admittance and conductance systems require a series of volume calibration steps designed to overcome two main sources of error.
1. Parallel Volume Calibration
Firstly, the surrounding heart tissue conducts electricity and contributes to the overall volume signal.
This is known as our parallel volume and must be removed for accurate measures of volume.
The conductance system uses a process involving the injection of hypertonic saline into the blood, while the admittance system uses additional knowledge about the electrical properties of the blood and myocardium to automatically remove parallel volume from the equation.
2. Field Correction Factor Calibration
Secondly, the electrical field produced by the catheter is not uniform.
To account for this, a field correction factor, calculated from an independent measure of SV, is used as a final adjustment to the volume signal.
However, often it isn’t practical to make a secondary measurement of SV, as this may require expensive equipment or a more invasive surgical procedure.
What happens when you don’t calibrate your PV system?
To illustrate how failing to perform either of these calibration steps can impact your results, we recorded PV data using both admittance and conductance systems from the same 5 healthy rats, and explored the impact of various calibration techniques across the two systems.
Impact of Using Estimates for Parallel Volume Calibration
First, let's look at the various methods of eliminating the parallel volume (Vp) calibration for both systems. In this example, we will focus on how the use of estimates affects the commonly reported measure: End-Systolic Volume (ESV).
What happens in the conductance system?
In the conductance system, parallel volume is calculated by performing a saline calibration. Here, a saline bolus is injected into the animal, changing the conductivity of the blood, and allowing the user to calculate the component of the signal which is contributed by the surrounding heart tissue. This calibration step can be somewhat challenging and time-consuming to perform on individual animals.
Therefore, to circumnavigate this calibration step, conductance users substitute an average Vp calculated from a subset of a group of similar animals.
How do these assumptions impact your data?
When we apply this assumption across our group of 5 animals (Fig. 1), we can see that using an average Vp value caused a significant departure from our fully calibrated values for ESV. There were some extreme examples of this in our small group.
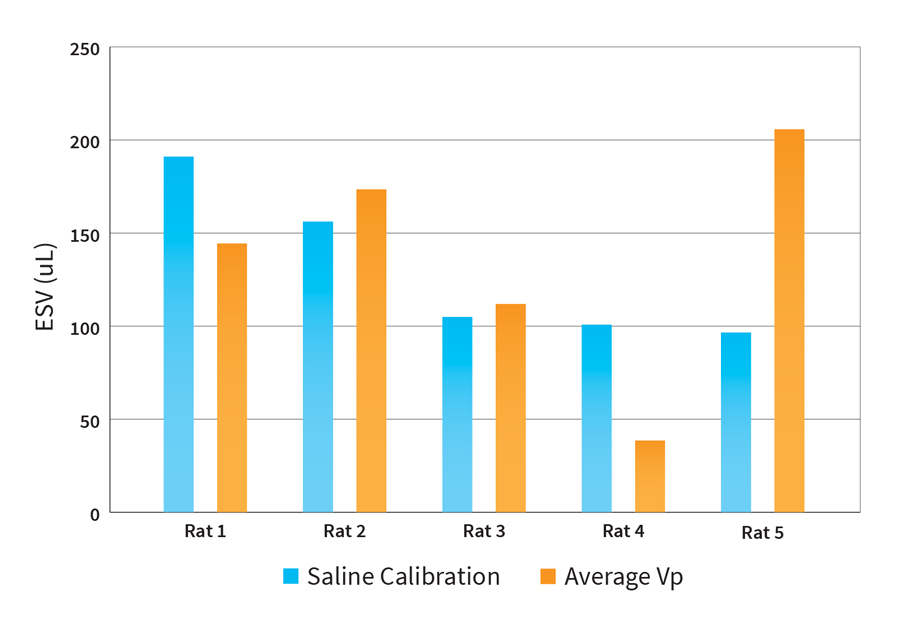
Fig. 1 Impact of using an average Vp over saline calibration for removing parallel volume in the conductance system (n=5).
Using an average value for Vp in place of a saline calibration for every animal may cause some significant errors in ESV for your data set.
What happens in the admittance system?
In the admittance system, a secondary surface calibration probe is used to measure the electrical properties (conductivity/permittivity) of the myocardium. This is known as the sigma/epsilon (S/E) ratio and is used to automatically remove parallel volume from the equation.
Because the placement of the heart probe requires the chest of the animal to be opened (which might not be possible in some experimental conditions), and is exceedingly difficult to accurately place on the surface of a beating heart and get a consistent reading, it is common practice for admittance users to use the default S/E values provided with the system.
In our investigation, collecting valid data for the S/E ratio for each of our animals was extremely difficult, and we were unable to capture realistic values that we could use as a comparison. So instead of using real calibration values, we explored the impact that using the 3 different S/E values: Healthy, Myocardial Infarction (MI), and Hypertrophied can have on your data.
How do these assumptions impact your data?
Looking at the PV data across our 5 animals (Fig. 2), varying the S/E value from the provided healthy default (800K), to that for a MI heart (900K), and lastly to a Hypertrophied heart (700K) has a linear impact on the reported ESV for each animal.
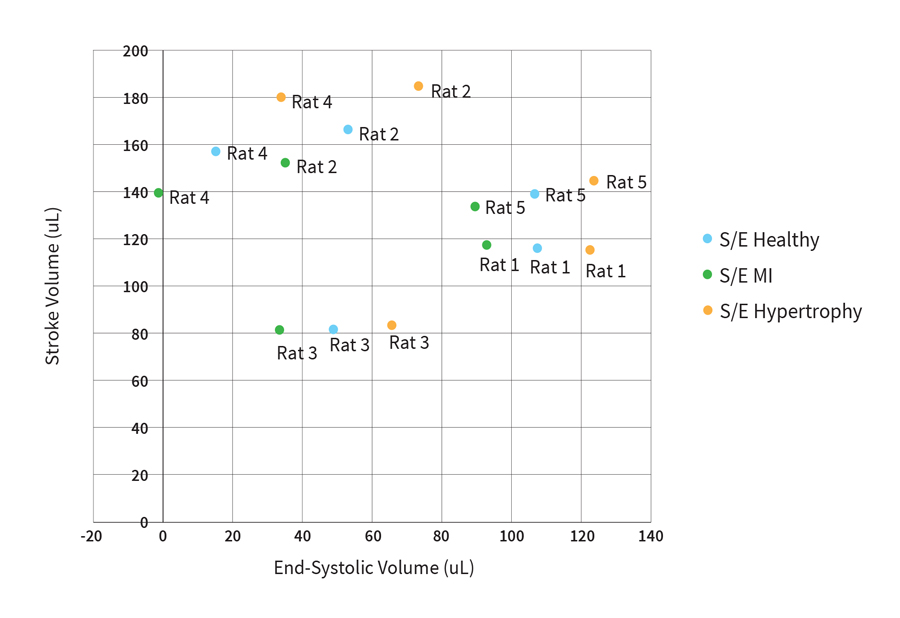
Fig. 2 Impact of using estimated S/E ratios (Healthy, MI, or Hypertrophied) for removing parallel volume in the admittance system (n=5).
While these S/E values may seem like practical choices, choosing an arbitrary S/E value to differentiate between your animal models can pose further problems to the accuracy of your data.
Let's assume you have three groups in your study; Healthy (control), Diseased (MI), and Diseased but treated.
Assuming there is sufficient remodeling to the heart between the control and diseased group (groups 1 & 2), selecting a change of S/E from 800K to 900K, may actually be reflective of the differences between these two groups. But this assumes the impact of this remodeling is precisely the same in every instance.
But what about group 3? Are they considered to be diseased (MI) or healthy? Either choice biases the data for your treatment group in a predictable way, either toward the healthy or diseased group.
Because your choice of S/E (if not directly measured) artificially changes the value for ESV (or any absolute volume value), it’s important to consider whether the choice you’ve made to differentiate your calibration along the lines of your animal models is potentially pre-determining a difference in outcome.
Note: In our investigation of the impact of using these default S/E values, the original reference paper suggests S/E values ranging from 1100K to 1800K,1 while the admittance system defaults are well outside this range.2 It is unclear where these default values have originated or why they are suggested for admittance users.
Impact of Using Estimates for Field Correction Factor Calibration
Next we'll look at how using estimated values for calibrating the field correction factor can affect the commonly reported measure: stroke volume (SV).
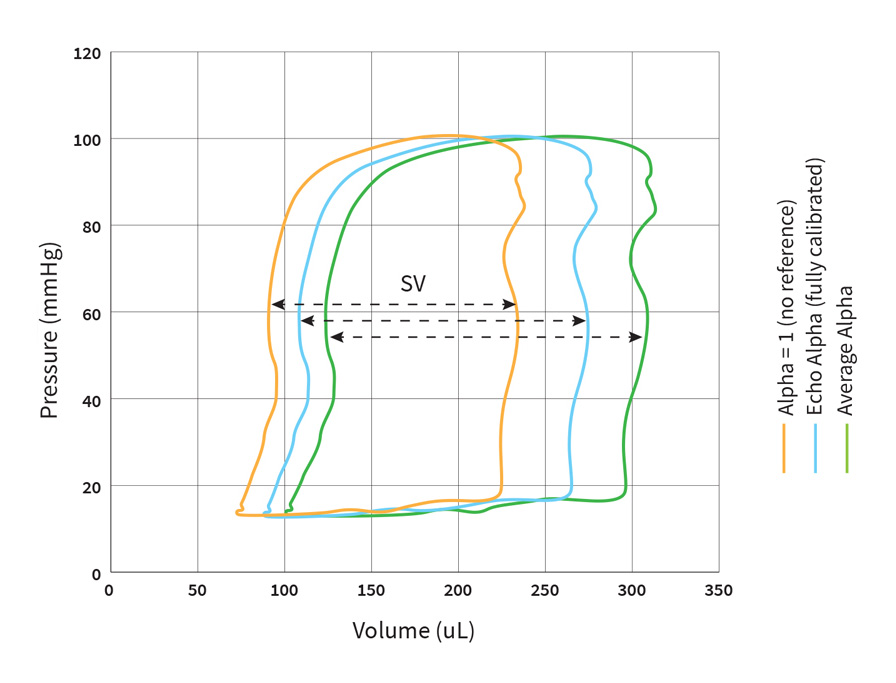
Fig. 3 Impact of using estimated values (alpha=1, or average alpha) for the field correction factor calibration (alpha) on PV loop data in the conductance system (n=1).
What happens in the conductance system?
Due to the size and shape of the ventricle in small animals, the catheter’s electrical field is almost parallel to the catheter; therefore, the field correction factor (alpha) will be very close to one3 and thus can be assumed to be one. 
Another approach is to use an average alpha value for a group of animals, which assumes that the level of underestimation of the raw conductance data will be similar among a specific grouping of animals.
How do these assumptions impact your data?
If we look at the PV loop data from a single animal (Fig. 3), assuming the alpha scaling factor to be one will most likely give you an underestimation of volume compared to a fully calibrated system using Echo*.
On the other hand, using the average alpha value results in an overestimation of volume for this animal. However, this result may vary between animals.
When we consider the impact of these two decisions across our group of 5 animals (Fig. 4), you can see that compared to an Echo referenced stroke volume*, assuming the alpha value to be one results in an underestimation of SV (on average 39 µl) across the 5 animals.
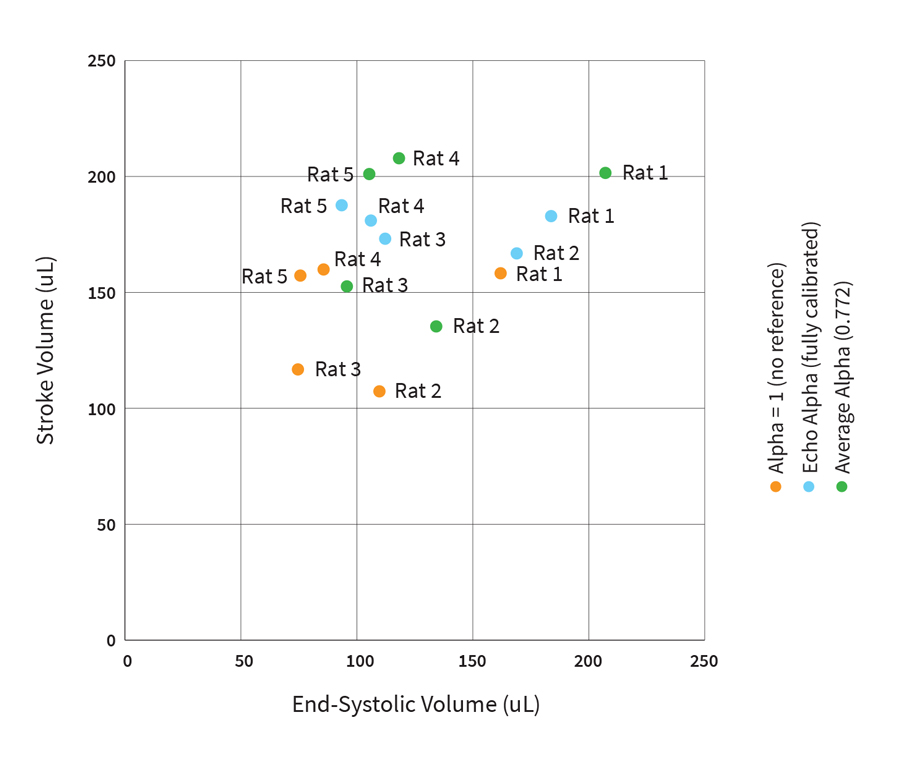
Fig. 4 Impact of using estimated values (alpha=1, or average alpha) for the field correction factor calibration (alpha) on reported SV’s for the conductance system (n=5).
And, again in the instance of using an average alpha value, the resulting output SV’s are different from the results of a fully calibrated system, but generally remain in a similar measurement range.
What happens in the Admittance System?
In the case of the admittance system, there are multiple methods of SV estimation recommended to researchers for calibrating the field correction factor. Instead of using a secondary piece of equipment (like Echo) to get an independent measure of SV, admittance users are advised to use the SV estimations that are provided with the system.
These estimates are based on the health or in some cases, the weight of an animal.4
In this example, we compared these suggested SV estimations, to an ideally calibrated admittance system, using Echo* as an SV reference.
How do these assumptions impact your data?
Looking at the PV loop data from a single animal (Fig. 5), when we compare the PV loop calibrated using the provided 200 µl SV estimate, to the loop calibrated using Echo, there is a large difference in the reported SV for that same rat.
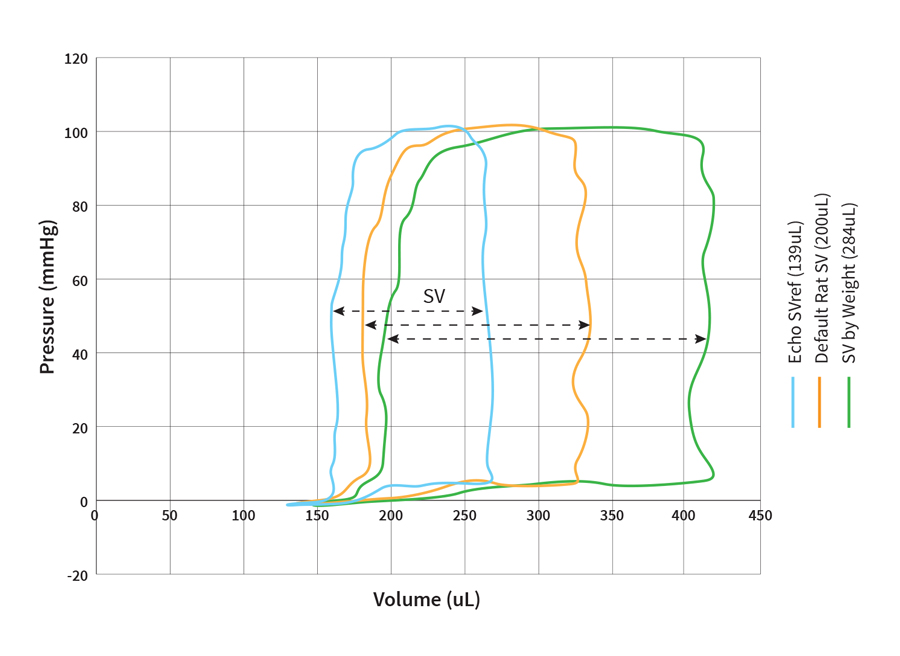
Fig. 5 Impact of using estimated values (by animal health or weight) for the field correction factor calibration on PV loop data in the admittance system (n=1).
Furthermore, when we use the other suggested estimate, based on the weight of the animal we get an even greater difference in the reported SV.
When we apply these estimates across our subset of 5 animals (Fig. 6), the use of the “default value” of 200 µl for a healthy rat consistently results in an overestimation of stroke volume in comparison to the Echo calibration.
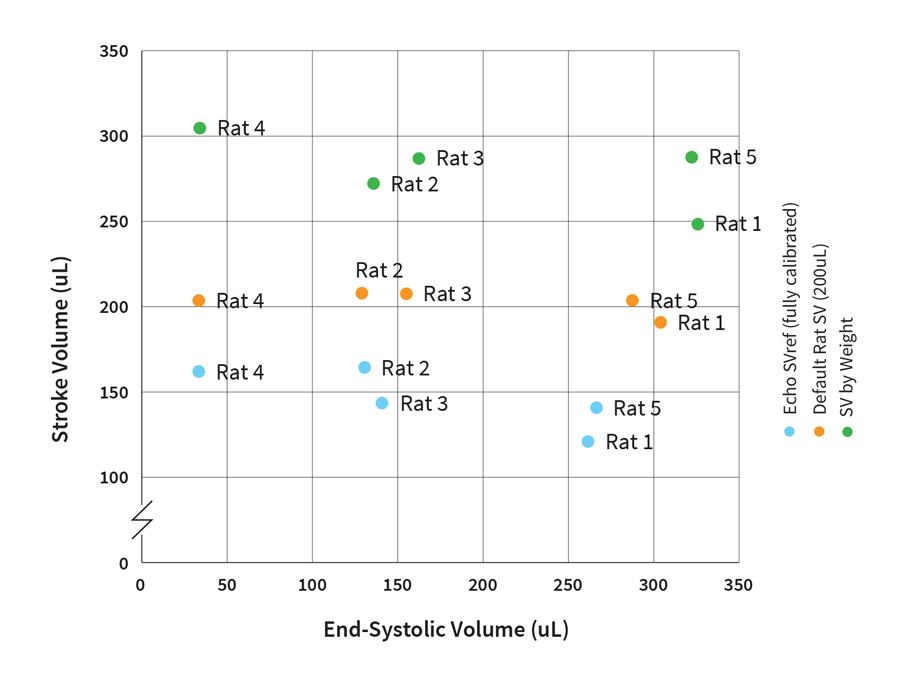
Fig. 6 Impact of using estimated values (by animal health or weight) for the field correction factor calibration on reported SV’s in the admittance system (n=5).
In addition, the variability of SV values across the 5 animals is reduced, causing all of the reported values to be tightly clustered around the 200 µl reference value.
This means that by selecting the same default SV reference across your group of animals, you are predetermining your output stroke volume data, eliminating any possibility of using SV as a parameter for comparison between groups.
Again, we can see that using an estimation by weight, results in an overestimation of SV (on average 134 μl) when compared to the fully calibrated system.
As we can clearly see, choosing to use an estimation of SV - as many admittance users are encouraged to do, over properly calibrating your system for each animal (e.g via Echo), will give you a set of results that may no longer be physiologically relevant.
*Reference stroke volumes were calculated using M-mode echocardiography.
Key Considerations
As we can see, failing to perform the correct calibration procedures can lead to wrong data and false results in both systems.
Choosing to use estimates to circumnavigate either calibration step can impact your ability to report on certain cardiac measures like SV, ESV, CO, and EF where absolute volumes are required.
This article is focused on the impact of calibration on steady-state volume parameters, and our conclusion doesn’t extend to the effects that using different methods of estimation can have on other cardiac parameters such as contractility. However, we predict that these parameters will be impacted differently, and to a lesser extent than those reported in this article.
As such, we strongly recommend you consider the effects that not properly calibrating your catheter, for either PV system, may have on your research outcomes, as certain parameters like SV and ESV, which may be important to your research question, can be affected by these choices.
Take-home messages:
- Not following the recommended calibration procedures can lead to wrong data and false results - in both admittance and conductance systems
- Using estimates assumes all animals to be identical and excludes for biological variation
- By using a predetermined estimate of SV as you reference across a data set, you are eliminating any possibility of using SV as a parameter for comparisons between groups.
- Choosing to use a provided S/E value for a particular heart-type can artificially pre-determine a difference in volume outcome.
We hope you found this information helpful! If you have any questions or would like to discuss this topic further, please reach out to your local ADInstruments Technical Support Representative.
Download PDF version of article
![]()
Accuracy Matters - Millar Research Catheters
Since 1969, Millar, Inc. has been a pioneer in the development of advanced pressure sensor technology to fuel groundbreaking research. Around the world, animal researchers rely on Millar technology, to make measurements, and decisions, with unprecedented accuracy, precision and confidence.
ADInstruments are the exclusive global distributors of Millar Mikro-Tip® catheters and associated hardware for ventricular pressure volume recording and invasive pressure recording.
By combining Millar’s high fidelity, minimally invasive catheters with the precision of PowerLab data acquisition and LabChart data analysis software, you can build a high quality, flexible system that will give you comprehensive data you can trust, every time.
Related resources
- Introduction to PV loops: Understanding points on the PV loop and measures of cardiac function
- Webinar: Understanding Ventricular Pressure-Volume Catheter Calibrations and Experimental
- Surgical Instruction Video Series: Pressure Volume (PV) and Invasive Pressure
- Webinar: Cardiac PV Loop Data Analysis Tips & Tricks
References
- Raghavan, K., Porterfield, J.E., Kottam, A.T.G. et al. (2009) Electrical Conductivity and Permittivity of Murine Myocardium. IEEE Transactions on Biomedical Engineering, 56(8), 2044-2053. doi: 10.1109/TBME.2009.2012401. PMID: 19605306.
- Konecny, F. (2014). PV Workbook: Tools & Techniques for Pressure-Volume Hemodynamic Studies. Ithaca, NY: Transonic Systems Inc.®️
- Yang, B., Larson, D.F., Beischel, J. et al. (2001) Validation of Conductance Catheter System for Quantification of Murine Pressure-Volume Loops. Journal of Investigative Surgery, 14(6), 341-355. doi: 10.1080/089419301753435710. PMID: 11905502.
- Mulla, W., Etzion, S., Elyagon, S. et al. (2017) Prominent differences in left ventricular performance and myocardial properties between right ventricular and left ventricular-based pacing modes in rats. Sci Rep 7, 5931. https://doi.org/10.1038/s41598-017-06197-w