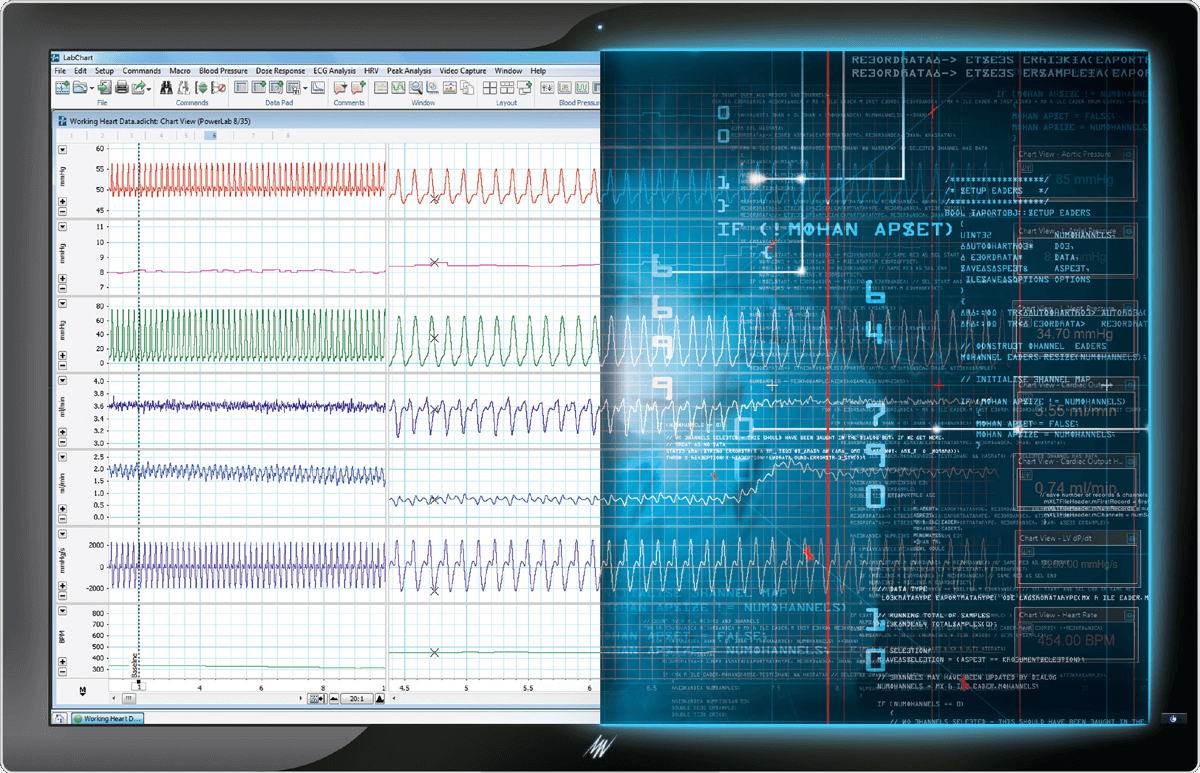
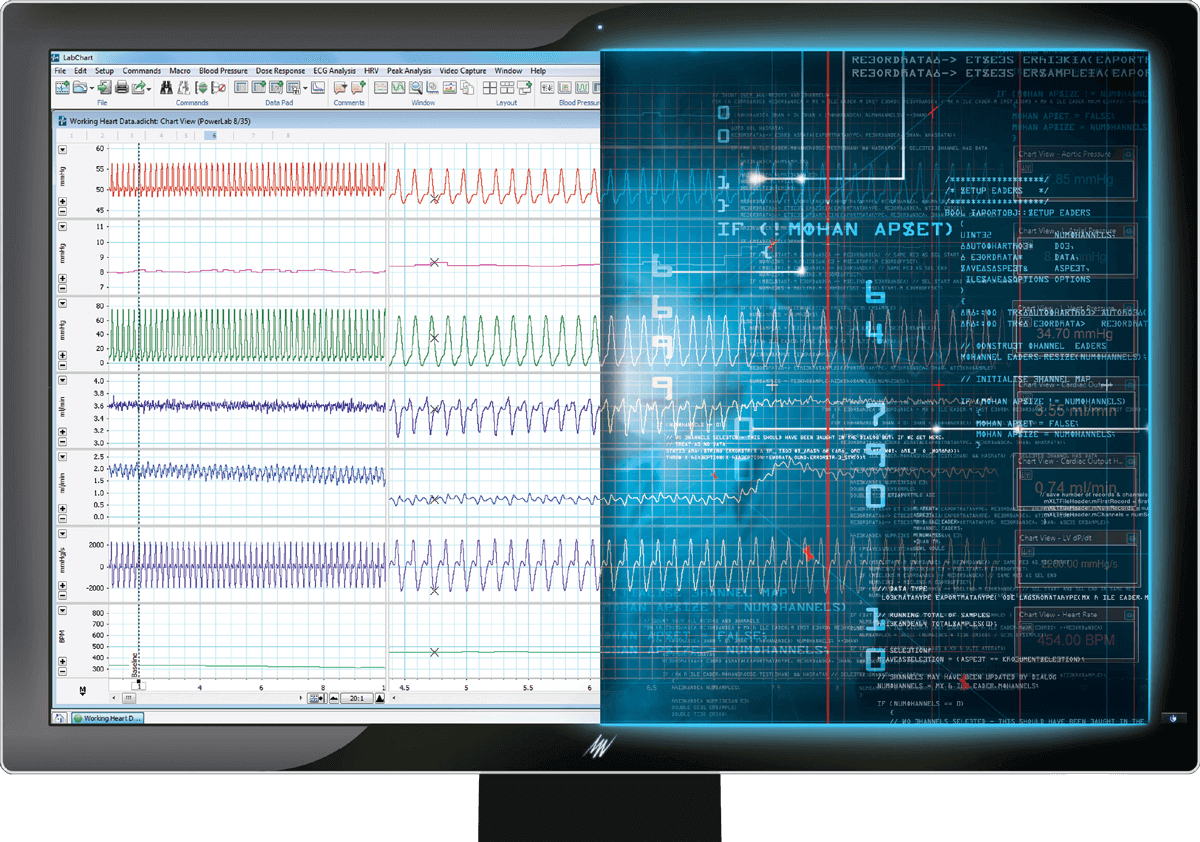
LabChart physiological data analysis software creates a platform for all of your recording devices to work together, allowing you to acquire biological signals from multiple sources simultaneously and apply advanced calculations and plots as your experiment unfolds.
-
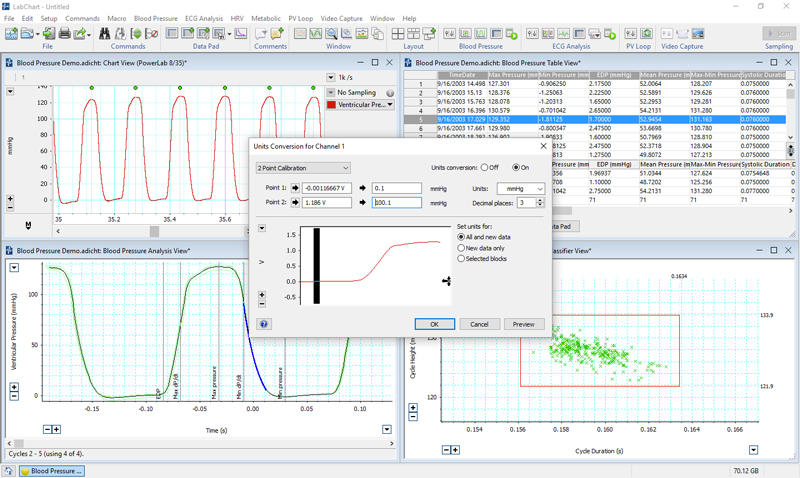
Blood Pressure and Units Conversion
Find the Mean Arterial Pressure, Systolic Pressure, Max dP/dt and others in your ventricular or arterial blood pressure recording in seconds. Our Blood Pressure module is incredibly simple, and produces results faster. Our simple two point calibration tool makes converting Voltage units to known measurement units quick and simple.
-
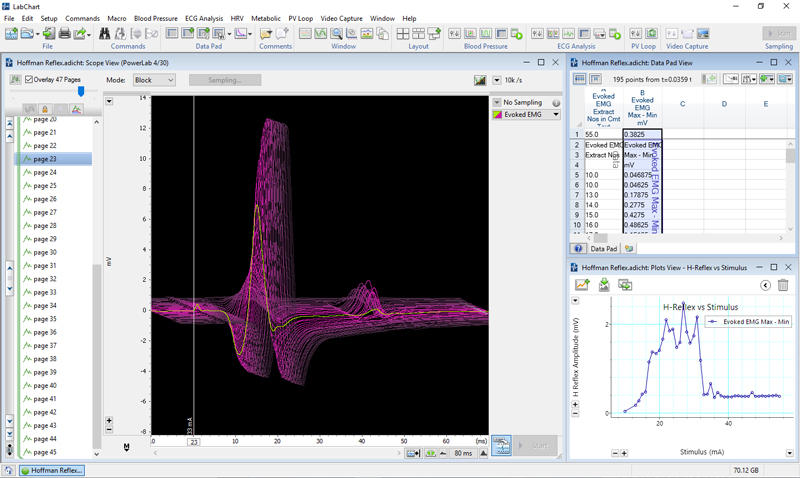
Comments, Scope View, Data Pad and Data Pad Plots
Annotate your data during or post acquisition to aid in navigating your traces later. With Scope View you can display, overlay, average and analyze periodic or evoked waveforms in real time. Do more within LabChart while you record, by using Data Plots. Data Pad then offers the most flexible method of converting your time based raw data and calculations from the chart view to discrete values for use in statistical analysis.
-
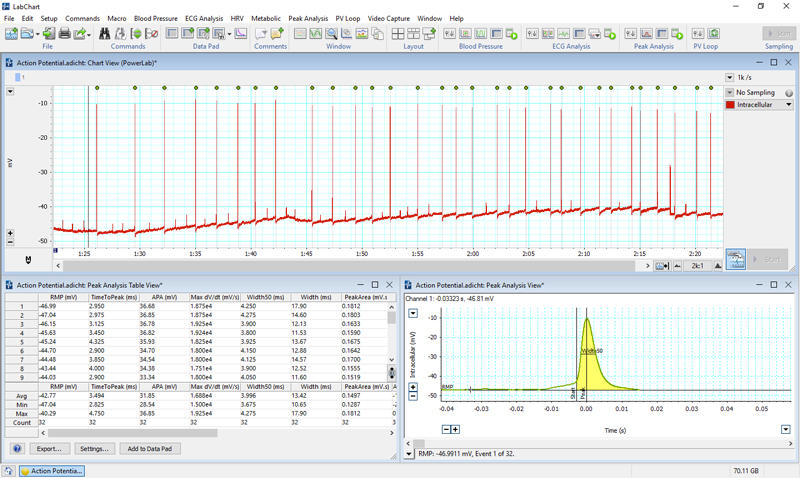
Peak Analysis
This analysis tool is not one to be underestimated. Intended for the general task of peak detection and providing analysis parameters like peak height, half-width, latency period, population spike height, rise time, area and tau, this packs a punch with dedicated detection algorithms and flexible analysis packages. (Windows only)
-
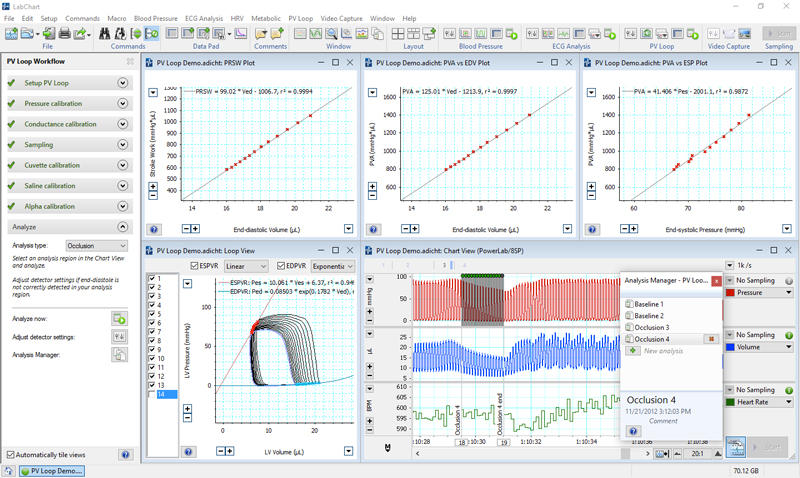
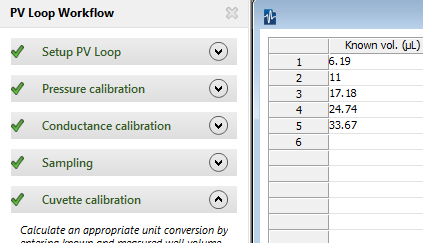
PV Loop and Analysis Manager
The Workflow mode for PV Loop steps you through each phase of the PV procedure, helping you to acquire the results you need for this powerful cardiovascular application. With Analysis Manager, you can save and label your selections and analysis regions and recall them at a click.
-
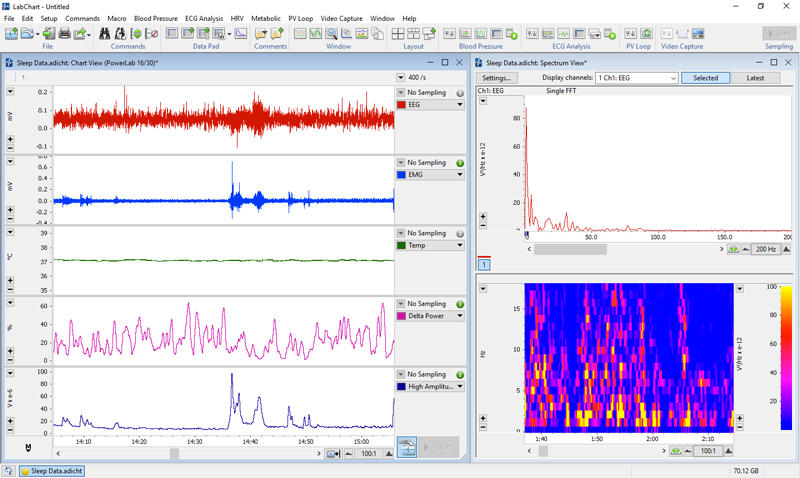
Spectrum View and Arithmetic
With Spectrum View, powerfully convert your time based signal to its component frequencies. Arithmetic, our post powerful channel calculation allows you access to LabChart's calculation engine, allowing customized formulae, detection, and analysis. Take that equation direct from the textbook or article and build it within LabChart.
-
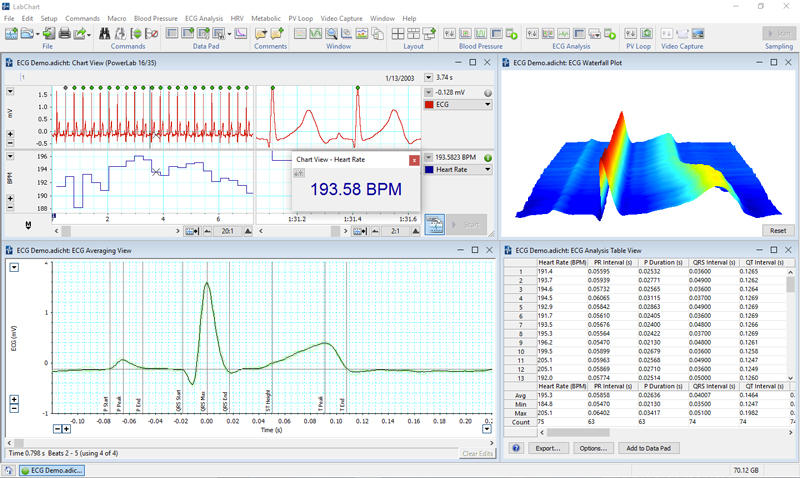
Split View, DVM, ECG Analysis, Cyclic Measurements
Split View shows chart view traces with two separate x-axis displays. View long term trends long side the latest data with this beautifully clever display feature. ECG Analysis makes PQRST as easy as ABC with automated waveform detection and classification. DVM and Cyclic Measurements offer different analysis options.
-
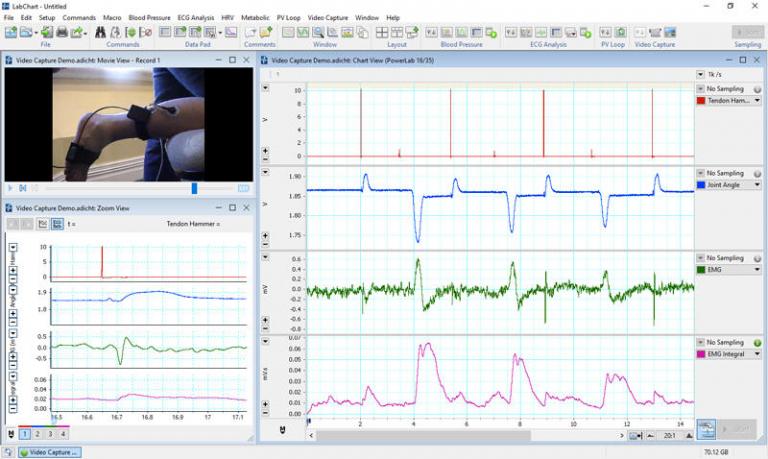
Video Capture, Zoom View and Channel Calculations
Record and replay synchronized video along side your physiological recording. Zoom View allows you to take a closer look at an event, compare the timing between two overlayed channels, and export your images to publish. Quickly change your displayed channels or add a calculation.
-
![]()
Simple To Use
LabChart lets you do the basics with a minimum of fuss; advanced features stay out of the way until the moment you need them.
![]()
Customize Your Workflow
Make LabChart work the way you want. Use scripting and automation (Windows only), custom arithmetic, and import/export data in various formats for use in other applications.
![]()
Feature-Rich
LabChart’s range of sophisticated Add-Ons are purpose-built for signals specific to life science, e.g. cardiovascular, respiratory, blood pressure, neuronal and dose response data.
Life science software designed for quick and easy use, for full control of your data
- Preconfigured settings files for one-touch recordings
- Smart detection of all ADInstruments peripheral devices
- Welcome Center for single-click access to all your files, support, and new software features
- Manual or event-driven sampling
- Signal specific analysis tools
- Fully customizable stimulator control
- Full layout control – only display what you need to display
- Easily modify signal detection algorithms
- Set up hot-key macros for automating repetitive tasks (Windows only).
- Scripting environment for custom signal analysis (Windows only).

Request a demo
Tell us about the research or teaching you want to do and we can demonstrate how LabChart could help.
Book a demoNew in LabChart 8
PV Loop
PV Loop 2.5: For left and right ventrical studies. LabChart's latest version of the PV Loop analysis...
HRV 2.0
This comprehensive suite of analysis views include the Tachogram, RR and Delta RR Interval histograms, Poincare, and Power Spectrum Windows.
Student Licenses
Get professional, research grade software for students.
Continuous support, with training when you need it
Our experts will provide one-on-one assistance to support you in using LabChart to achieve your research and educational goals.
Our hands-on, practical training courses are run by experienced scientists with extensive product knowledge and are available for users of all abilities and experience.
What LabChart customers say about our training
"Our trainer was well presented, knowledgeable and friendly. I hope he will present advanced LabChart training courses in the future."
Nor-Fasihah Azam
Universiti Sains Malaysia
"The course has given me new appreciation of the power of LabChart and the confidence to help students with their software queries. In the past I would refer them to tutors to resolve their issues. I feel much more equipped to help. Thanks ADI."
Karn Hinton
University of Auckland
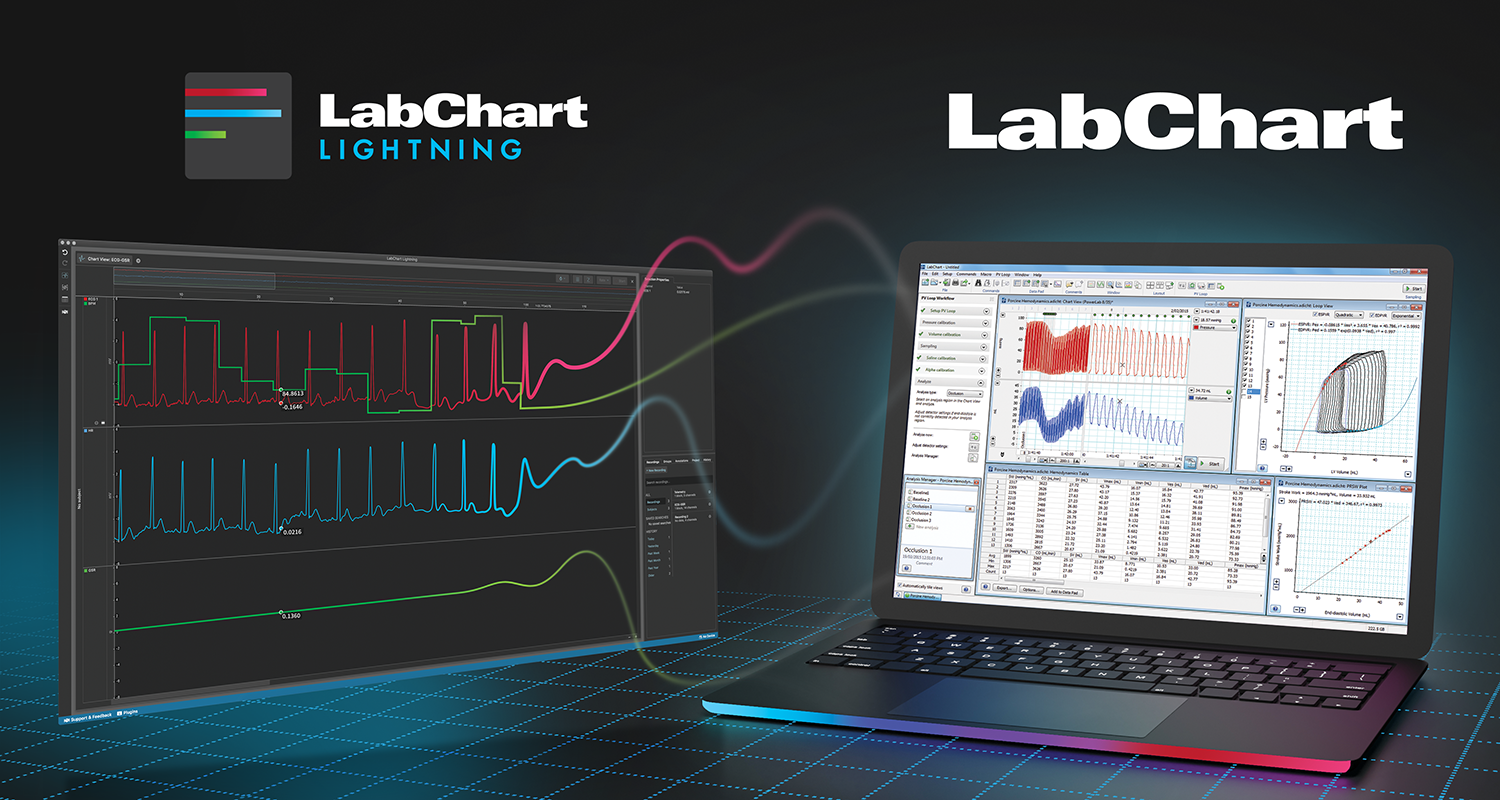
LabChart and LabChart Lightning offer researchers and educators a powerful data acquisition software package capable of integrating with ADInstruments’ modular suite of DAQ hardware. Data acquisition systems require high-speed integration across analog transduction, signal conditioning, data logging, and validation, all of which are supported by LabChart.
Data recording, analysis and visualization are also streamlined in the LabChart DAQ software packages. High quality graph production is integrated within the software suites. Both software packages permit the construction of specialized analyses and graphs such as peak analysis, spike histograms, and dose-response curves. Additionally, the data plot API permits users to visualize data in four different plot types and curve fits. Totalled, ADInstruments’ DAQ software packages are an essential component of any DAQ system.