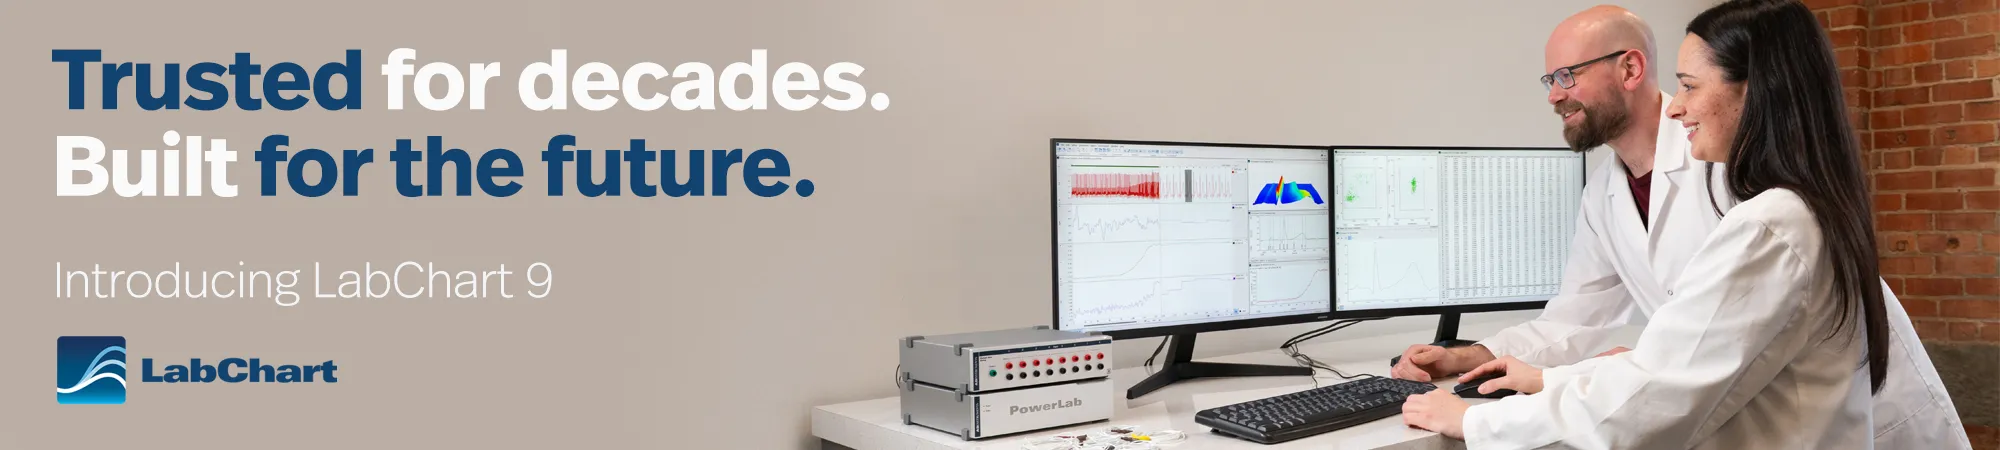

We are thrilled to announce the release of LabChart 9!

This release has been a long time coming. LabChart 9 builds on the functionality and reliability of LabChart 8, with new software architecture and features to support the evolving needs of researchers and educators worldwide. This initial launch focuses on quality-of-life improvements, preparing LabChart for the increased computational needs of cutting-edge researchers, protocols, and hardware.
LabChart is at the heart of what we offer at ADInstruments; a software built iteratively over 40 years to make science easier for researchers and educators. From the very beginning of its development, LabChart has had two core principles: power and simplicity.
“LabChart has to be a tool that’s functional, and does what scientists need it to do,” Alex Black, CEO of ADInstruments, says, “it has to be straightforward, so that people at any stage of their scientific journey can set up and start recording; and at the same time we want to ensure that LabChart is powerful enough to handle complex multi-layered protocols and calculations. Everything we add to LabChart has to align with those two principles.”
“The outcome of that alignment is that LabChart is the most cited physiological data acquisition software on the market, and we reliably get feedback from our users praising the ease of use and simplicity of the product.”

Alex Black
CEO of ADInstruments
With LabChart 9, we’ve taken a step back to reexamine the software as a whole, reassessing what ‘simplicity’ and ‘ease of use’ mean for software in a modern physiology lab. “With LabChart 9, we are taking the much-loved product of LabChart 8 and bringing it into the modern world,” Alex says, “this means improving speed, efficiency, the number of channels, and making quality of life improvements that will lay the foundation for further analysis features to be developed.”
Have a look at the new and improved LabChart 9 >>
What’s New in LabChart 9?
The additions to LabChart 9 are broad and deep, from surface-level visual finessing to core code-base upgrades. Our LabChart Product Manager, Sarah Dietrich, has been working tirelessly with her team to implement the changes they believe will have the greatest quality-of-life impact in the near and distant future for LabChart.

Sarah Dietrich
LabChart Product Manager
“LabChart 9 has an array of new features, each of which has been added in response to customer feedback,” Sarah says, “but something that is really important to me is that our existing customers have a seamless upgrade experience. If you’re already a LabChart user, all you have to do is install LabChart 9, and that’s it. You can open your existing files, continue with your analysis, and sample new data using your old settings files. You don’t have to change anything if you don’t want to.”
“We’ve focused on reducing the barrier to entry because most of our customers are really time poor, and they’ve got lots of work to be getting on with.”
Updates include
- Up to 64 channels of data (previously 32)
- Multiple monitor support
- 64-bit architecture with improved performance
- Continuous automatic scaling for XY view
- PowerLab T1 and Sensors support
- Use two stimulators simultaneously
- Pulse train and S1-S2 stimulator waveforms
- Stimulator waveform preview
Learn more about the features of LabChart 9 here >>
Learn more about LabChart 9 and PowerLab Sensors compatibility >>
What lies ahead for LabChart?
These improvements lay the groundwork for the future of both software and hardware at ADInstruments. As we develop future analysis modules and move toward implementing greater communication between our software and hardware, we need to ensure that LabChart remains simple, flexible, and reliable. Software-applied settings are the next step for our hardware, making it easier to set and record the exact settings you’re using, save them for later, and share them alongside other data to facilitate more accurate reproduction of experimental protocols. By creating this complete software-hardware ecosystem, you, as the researcher, gain greater visibility over what your hardware is actually doing and software-based controls to adjust that functionality.

The power and simplicity of LabChart isn’t built by eliminating choices or smoothing over complexities; it’s in creating systems that guide you through those difficult protocols, protect the integrity of your data, and give you the functionality you need to perform your research your way.
“LabChart has always sat at the centre of our research products,” Sarah says, “we sell a lot of different kinds of hardware, but no matter what hardware you’re using, you’re using it with LabChart. So, no matter where your research goes, or what signals you end up adding, LabChart already does everything that you need. You can add new hardware, but the software you’re using can stay consistent, and that just makes life easier.”
“I’m very excited for the future of LabChart. I’m so proud to work on something that is used by scientists all over the world, and that they really love to use. We get to keep making improvements and adding new features that help people do meaningful research. It’s really satisfying to know that the things we’re adding will be relevant to researchers across a broad range of life science applications. And we’re sticking at it. LabChart 9.0 is just one release; there’ll be more and more after this and into the future.”

LabChart 9 sits at the heart of our lab systems. No matter what hardware you're using, LabChart is here to help you make the most of it.
Learn more about LabChart 9 >>
Explore LabChart Resources >>
Book a LabChart 9 demo >>