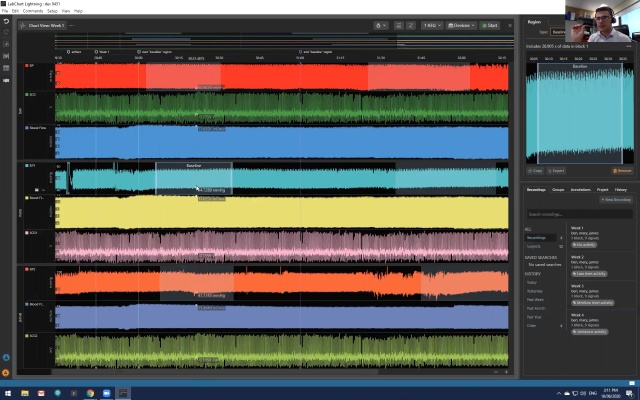
Region Generators
You can now automate the creation of large quantities of regions using the new Region Generator view. This allows you to quickly collate data across your entire project, ready for viewing in the Table view.
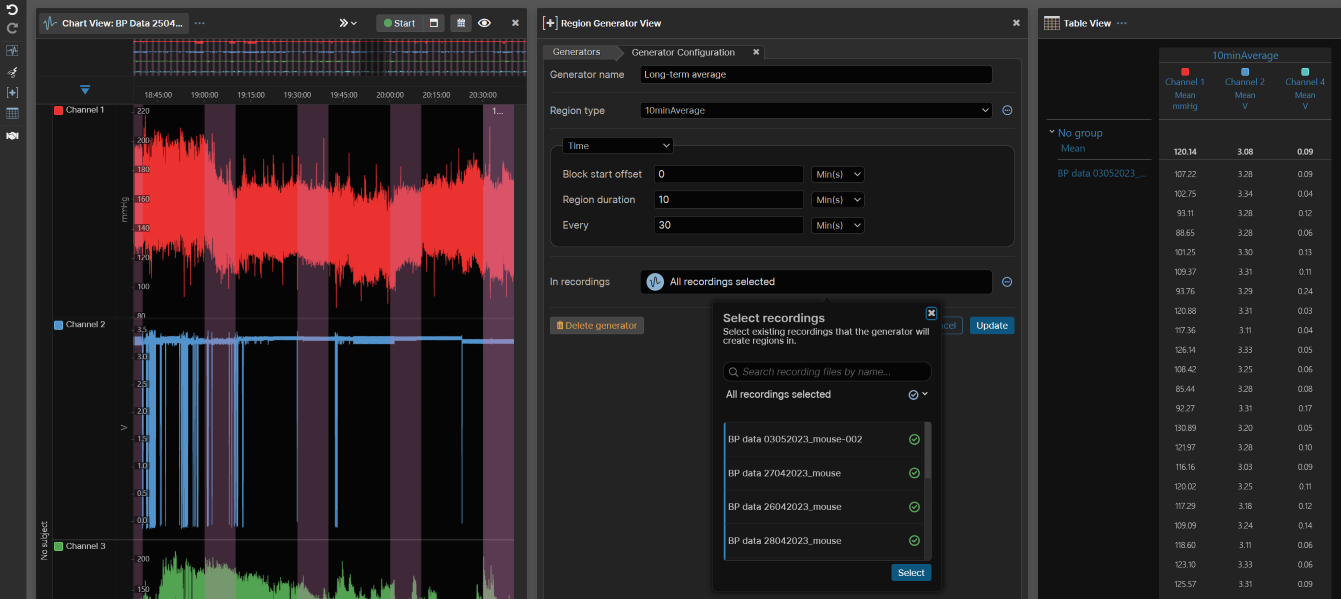
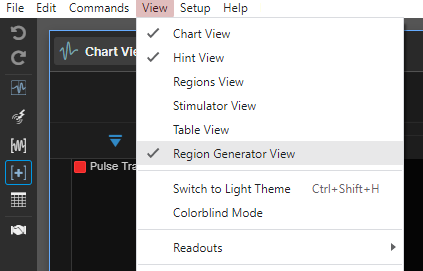
Open the Region Generator view from the left-hand toolbar or from the View menu.
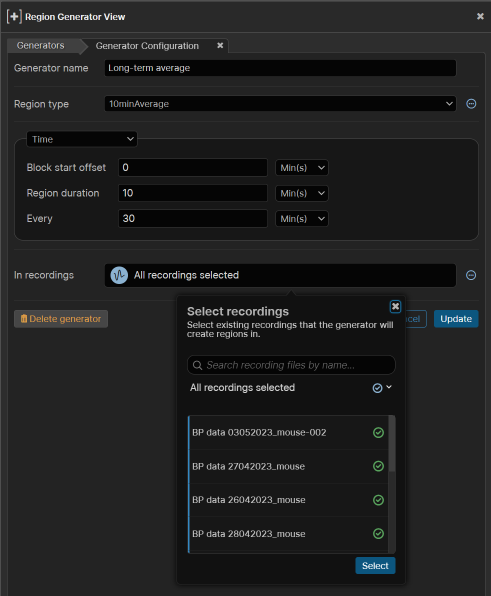
Regions can be generated on the basis of time throughout a recording block. You can specify the duration of generated regions, the period between beginnings, and an offset from the start of recording blocks from which to start creating regions.
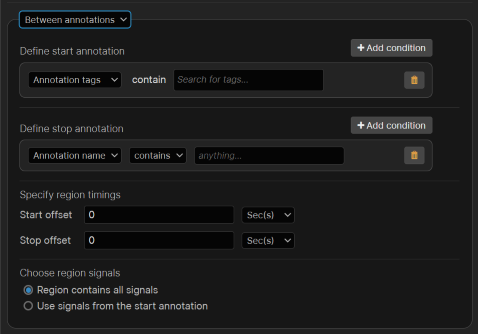
Regions can also be created based on annotations, generating regions between or around them. You can specify search criteria for annotation names or tags and timings around those annotations.
Additional settings include the type of region to be created and the recordings in which to create them.
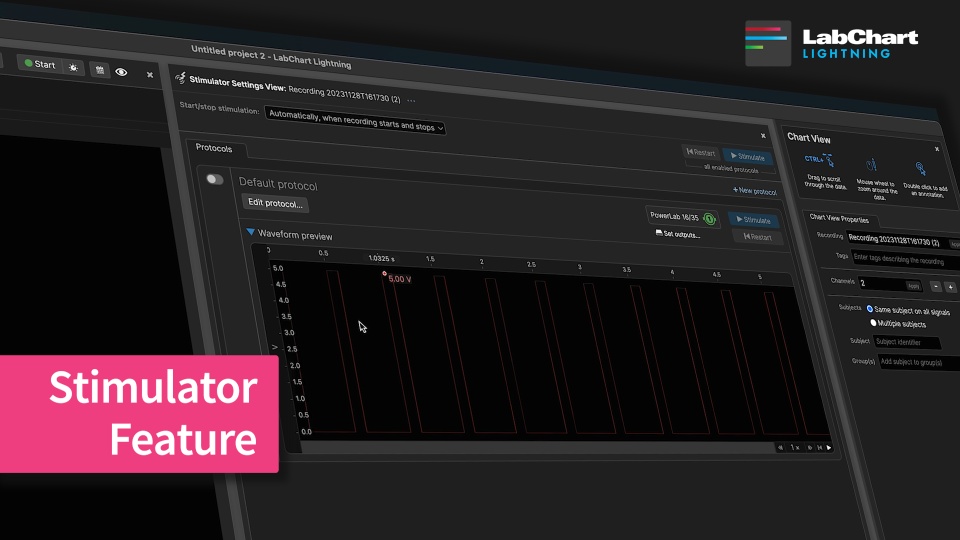
Improved Stimulator controls
We've made a number of improvements to help users using the stimulator:
- Stimulator parameter increments can now be edited from within the Stimulator View.
- If you are using the sampling control window to manage your stimulation during your experiment, you can now collapse these protocols to free up space so you can look at just the protocols you are interested at editing at any given time.
- The Stimulator control panel can be opened directly from the Stimulator View using a button in the top right-hand corner.
- You can now choose to specify the period and frequency at which your stimulator waveforms repeat.
- You can now undo and redo any stimulator configuration changes you make.
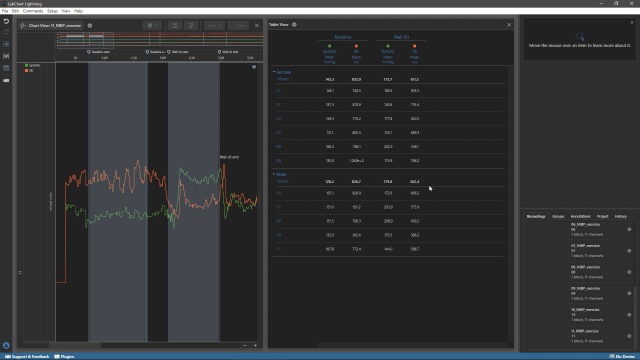
New Table Export Options
This release includes a new export format for data from the table which is designed to make it easier to run statistical analyses on your summary data. We also provide template scripts to get you started at https://github.com/adinstruments/LabChartLightningScripts.
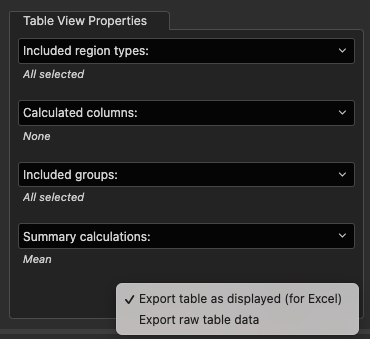
The Table View Properties now lets you select which format you want to export the table data in. This can be either the existing format where the data is exported as displayed in the table view, which is ideal for, e.g. Excel, or the new 'raw' format. This format is machine-readable and makes it easy to load your data into, for example, MATLAB, Python, or R.
Once exported, you can modify the template scripts from the GitHub repository to run your own analyses. The examples we provide demonstrate the basics of loading, reorganising, summarising, and running statistical tests on the table data.
Changes
Regions view
- The Regions View has been removed. It may return in a different form in the future, with the goal of making it more useful and relevant.
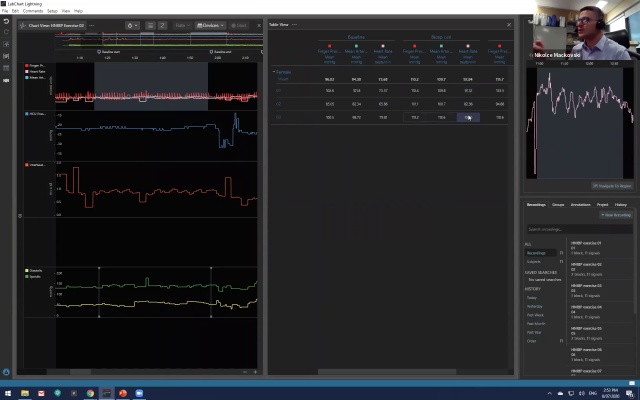
Table view
- The order of rows in the table is now in chronological order.
- Improved load time of projects with large tables.
- Drastically improved performance and accuracy of cyclic measurement columns within the table.
- When you reapply signal calculations, non-cyclic measurement cells in the table view now stay up to date.
- You can now see the events detected by cyclic measurement table cells in previews within the table.
- References to 'comments' in table calculations have been updated to refer to annotations.
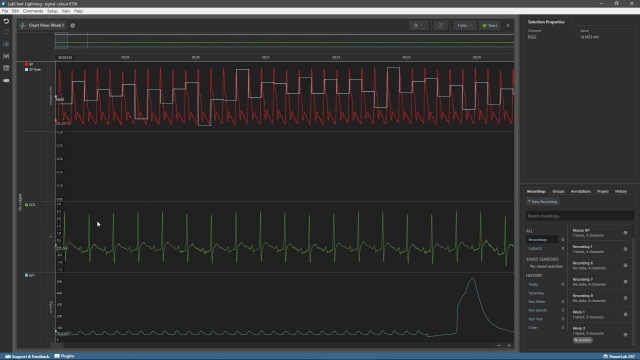
Chart view
- Signal trackers in chart view will now display data for the first or last samples in a block.
- Errors no longer appear when using the delta start in the Chart View.
- Reopening a project with a window of a different size now always displays all channels.
Stimulator
- When stimulator hardware is responding too slowly or fails to respond for any reason, you now see a warning instead of LabChart Lightning crashing.
- Stimulator protocol names are now case insensitive (you can no longer have a protocol named "Experiment" and a separate protocol named "experiment" within the same recording).
- An edit to the increment amount for a stimulator parameter now saves if you dismiss the settings popover quickly.
Annotations
- Annotations set to a subject will now only draw on signals associated with that subject.
- Preset annotations and quick annotations can now be created on specific subjects.
- Annotation edit controls will remain in sync after undoing or deleting an annotation.
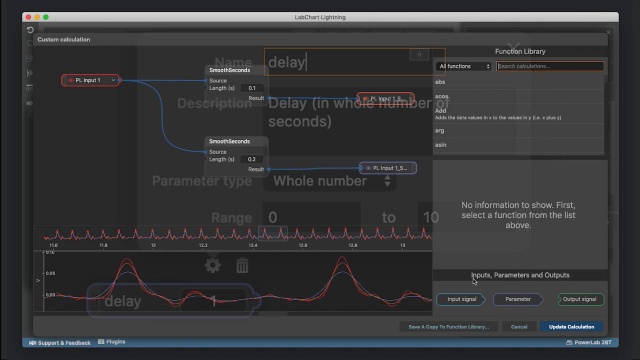
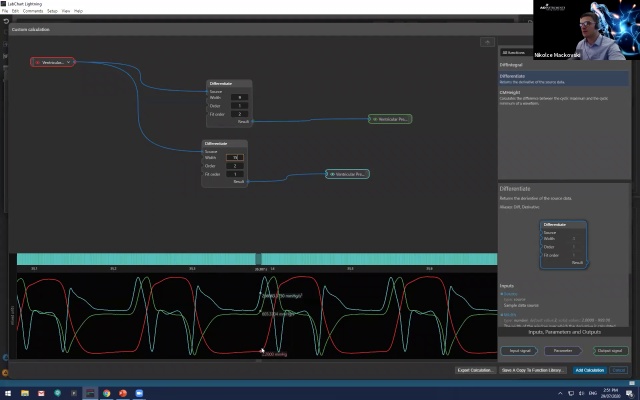
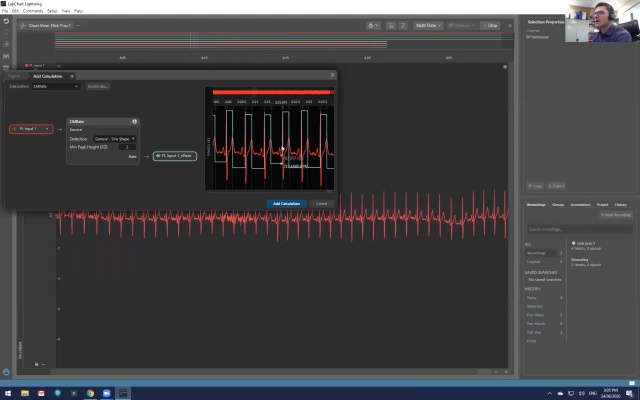
Calculations
- You can now edit all outputs and parameters for calculations with lots of outputs and/or parameters from the simple calculation view.
- Improved stability of cyclic measurements calculations.
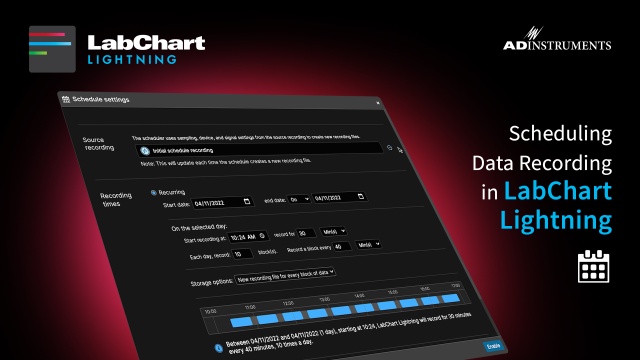
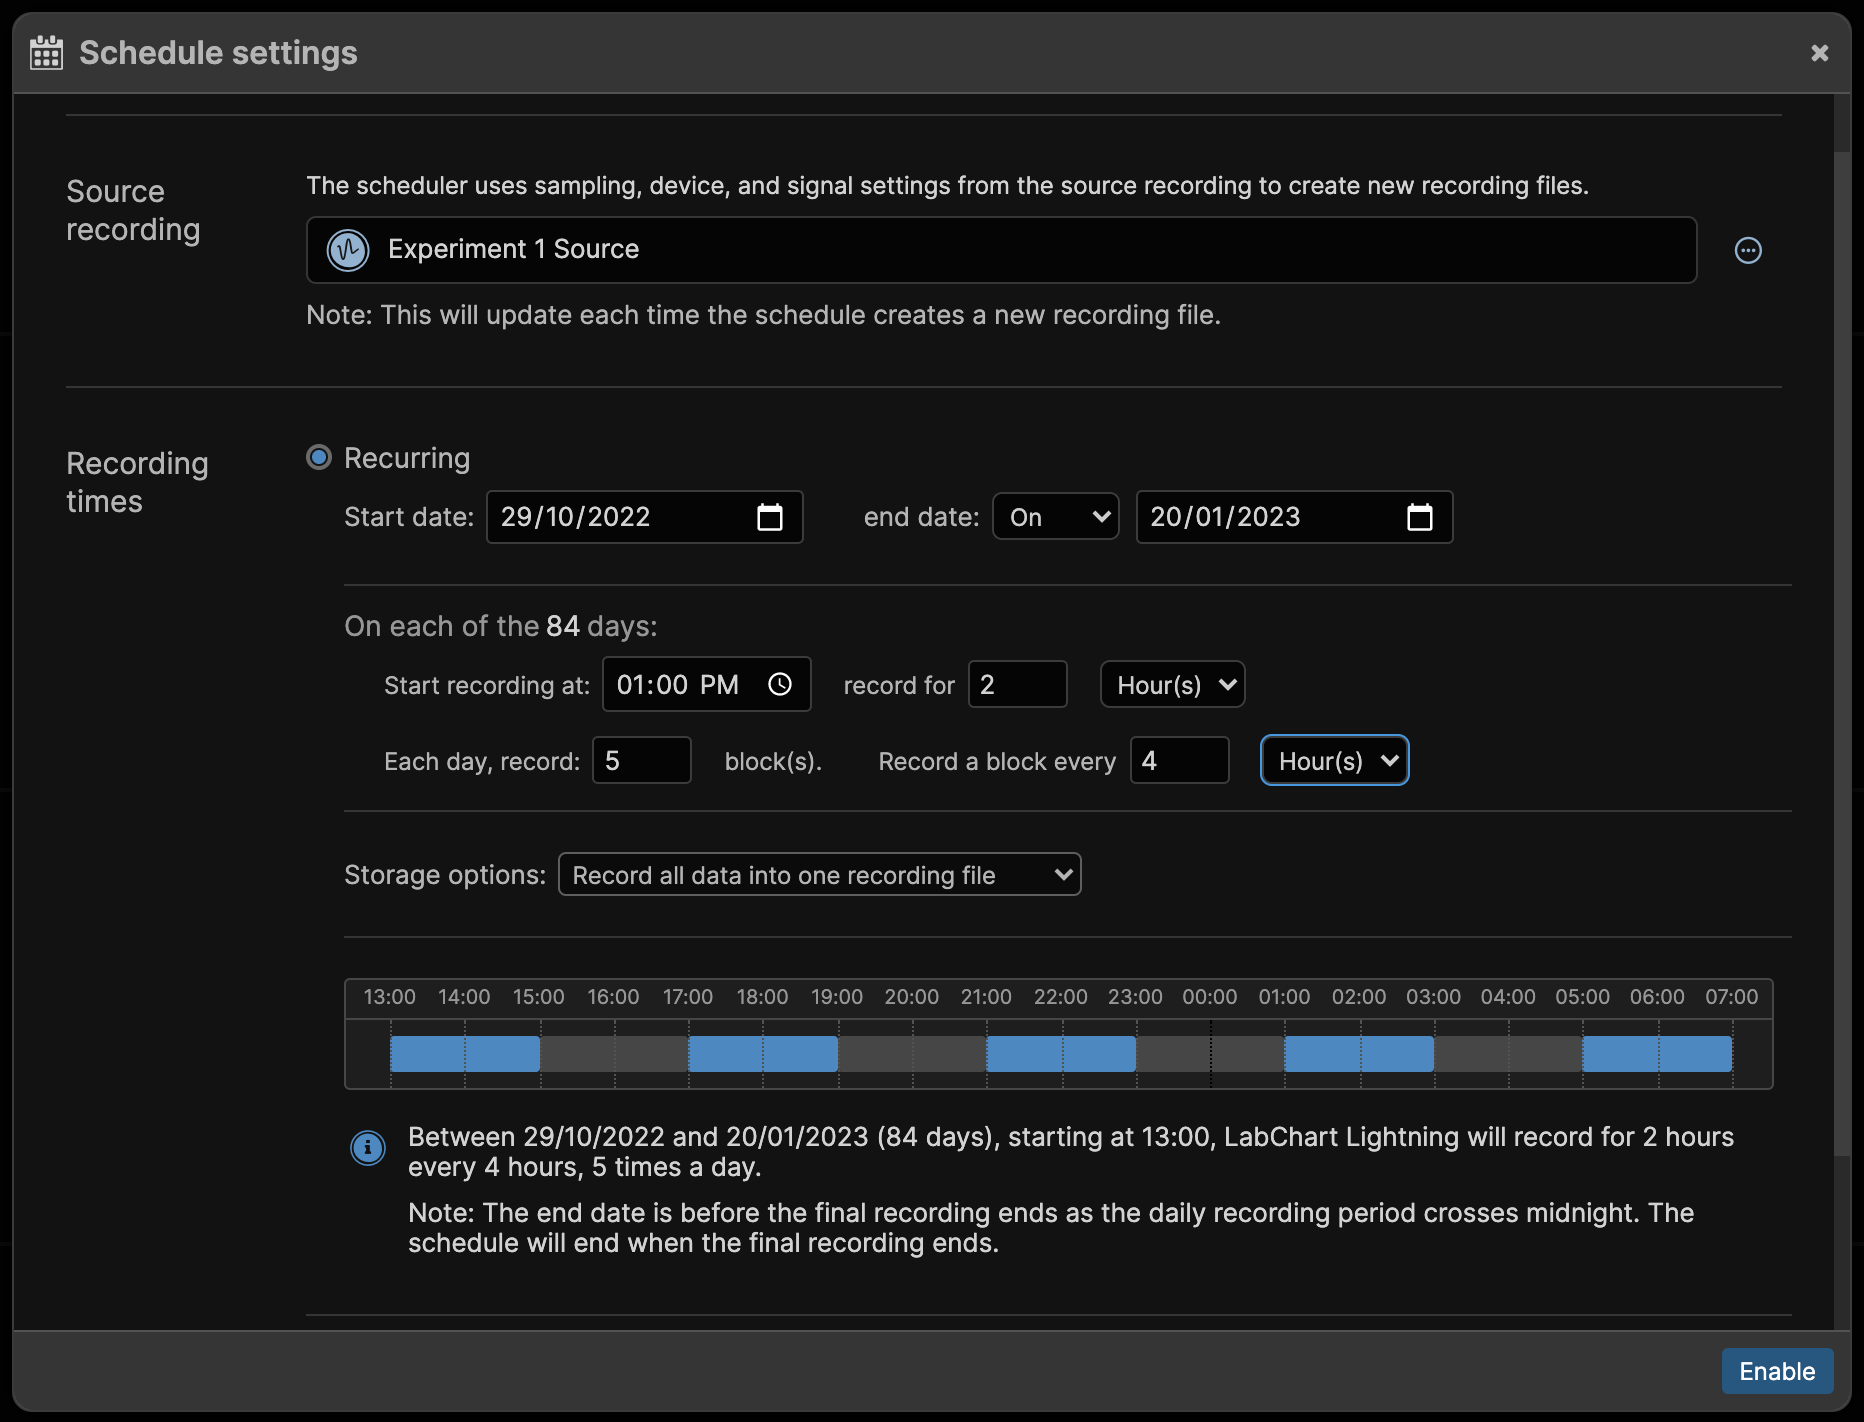
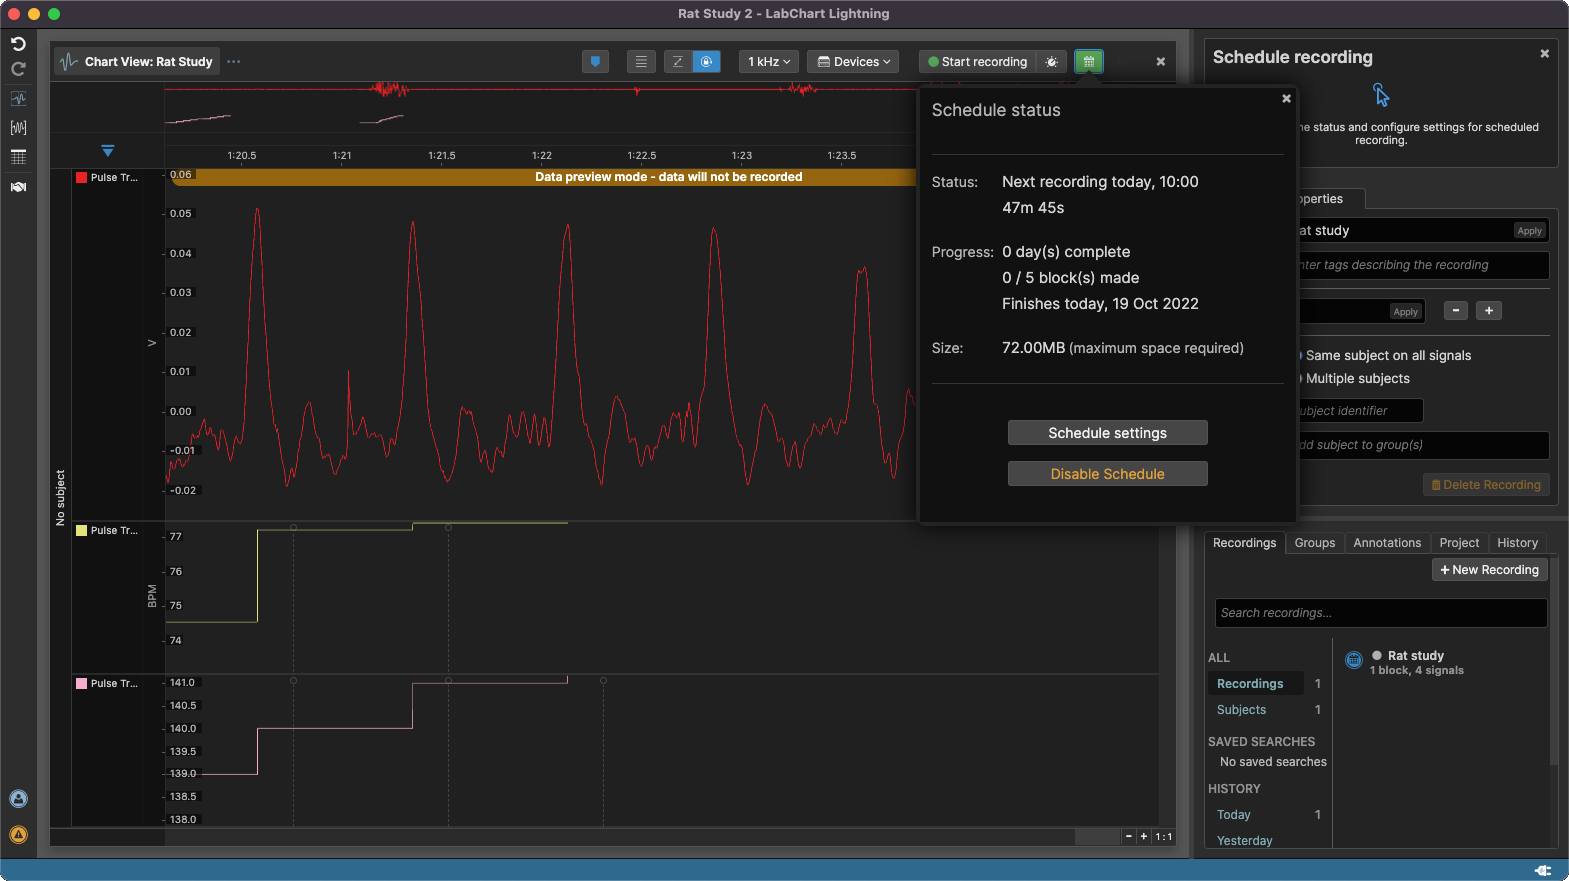
Scheduler
- Changes made to schedule settings are now saved if you close the project while editing it.
- Your schedule now records successfully after exiting the sampling settings popup when you edit the settings during its start time.
Other changes
- Switching from multiple subjects to the same subject on all signals no longer adds a (1) to the names of some signals.
- Signal names are no longer lost when device settings are changed.
- Selecting the "Today" filter in the recording picker will correctly show new recordings.
- When your login session expires you are now prompted to log in again instead of being told your username and email were incorrect.
- Reapplying a valid disabled unit conversion now reenables the conversion.
- Secondary windows no longer disappear when shifted to a second monitor on macOS.
- The TimeFormat specifier in the header of text-based data export formats is now correctly populated.
- Readout windows will not prevent quitting LabChart Lightning on macOS.
- LabChart Lightning cannot quit while a project is loading.
- Errors in opening a project do not prevent quitting LabChart Lightning.
New Known Issues
- Some columns in the table may disappear and default back to showing the mean as part of upgrading to this version. You can turn these columns back on again manually after upgrading.
- Generated regions created between annotations cannot be made over multiple blocks.