×

dP/dT

dP/dT

dP/dt is a signal derived from pressure, typically ventricular blood pressure, that indicates the change in pressure over time.

Ask a Question Book a Demo

dP/dT
dP/dT

Signal Overview

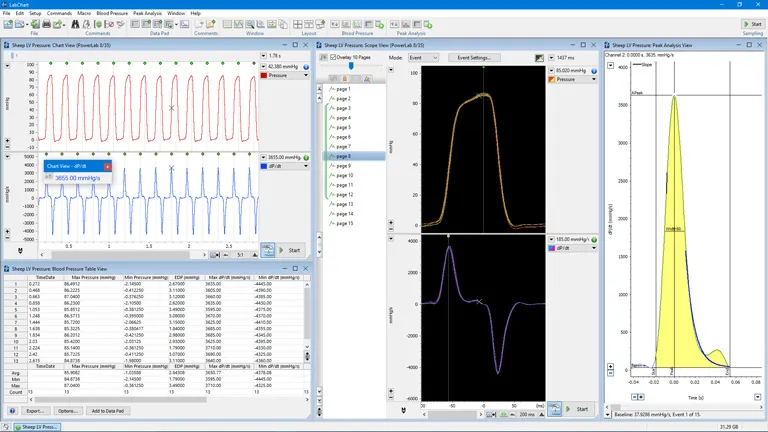
Measured ventricular pressure provides an indication of the contractility or relaxation of the ventricles of a heart. In this way, the derivative of pressure over time (dP/dt) provides a biphasic signal that can be used to evaluate acute directional changes of contractility. Statistical measures of dP/dt, such as the mean, maximum, minimum, time to dP/dt maximum or minimum are often extracted and analyzed.

dP/dt Maximum (peak dP/dt) is one of the oldest measures of left ventricular global contractility and is a good index of ventricular performance that is not influenced by afterload, wall motion abnormalities, or the variations in ventricular anatomy and morphology.

Time to dP/dt Maximum is a useful index for evaluating and comparing contractility between multiple subjects.

Signal
LabChart

Enabling Discovery

LabChart

All your analysis in one place

LabChart software is designed specifically for life science data and provides up to 32 channels for data display and analysis options that are powerful and easy to use. With auto-recognition of ADI and LabChart Compatible hardware, multi-window views, one touch recording, simultaneous recording from multiple devices, specialized preconfigured settings, easy sharing options and an interface that can be customized to show only the features you want to use.

Analyzing Multiple Selections with the Same Duration

The Set Selection feature is available under the Commands menu, and can be used in conjunction with the Analysis Manager feature for analyzing multiple selections with the same duration. There are various options to configure the selection, including determining its duration qualitatively via a mouse or quantitatively via a keyboard. Next, selecting the checkbox next to Locked, transforms the selection into a fixed movable selection on the recorded signal, which can be moved by simultaneously left-clicking, holding and dragging your mouse. Analysis can then performed and saved via Analysis Manager at each location of this movable selection.

×

Features and Add-Ons

Additional acquisition and analysis options to support your dP/dT analysis:

LabChart Lightning
LabChart Lightning
Play video

Data acquisition and analysis re-imagined.

Make unique discoveries with unlimited freedom and flexibility.

Try LabChart Lightning now for free

This site is protected by reCAPTCHA and the Google Privacy Policy and Terms of Service apply.

Oops, something went wrong...

Thanks, we've sent you an email with instructions on how to start your trial.

Request a demo

Thank you for your interest in dP/dT. Please complete and submit the form below and an ADInstruments representative will aim to get in touch within one working day. If you’d like to speak to someone immediately, office contact information is available from the contact page.

×

Ask a question

Thank you for your interest in dP/dT. Please complete and submit the form below and an ADInstruments representative will aim to get in touch within one working day. If you’d like to speak to someone immediately, office contact information is available from the contact page.

×