Sound

Vibration in air or another medium can be detected by sensory organs as sound. This can also be easily detected and interpreted by electronic instrumentation for utilization in life science research applications.

Image

Audible sound can easily be detected using a microphone and sampled through a PowerLab to LabChart. There are wide range of applications where recorded sound might provide utility in research.

A cardio microphone can be used to detect the timing of valve closures in the heart, or a sound may be played to a subject and simultaneously sampled in order to elicit and detect an emotional response. LabChart’s Audio Output feature can make use of this signal for qualitative investigation post analysis.

LabChart LabChart

All your analysis in one place

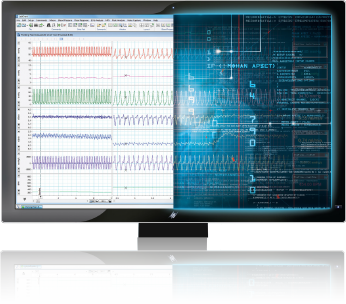
LabChart software is designed specifically for life science data and provides up to 32 channels for data display and analysis options that are powerful and easy to use. With auto-recognition of ADI and LabChart Compatible hardware, multi-window views, one touch recording, simultaneous recording from multiple devices, specialized preconfigured settings, easy sharing options and an interface that can be customized to show only the features you want to use.

Features and Add-Ons

Additional acquisition and analysis options to support your Sound analysis:

LabChart Lightning
LabChart Lightning
Play video

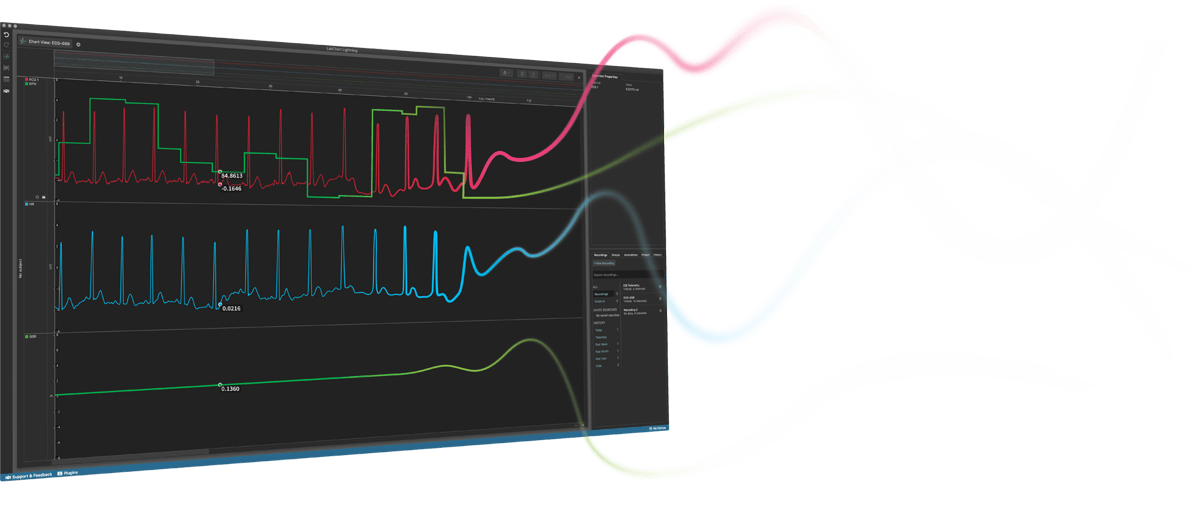
Data acquisition and analysis re-imagined.

Make unique discoveries with unlimited freedom and flexibility.

Try LabChart Lightning now for free

Personal Details
Institutional Details
Other Details