
Data acquisition
and analysis
re-imagined.
Make unique discoveries
with unlimited freedom
and flexibility.
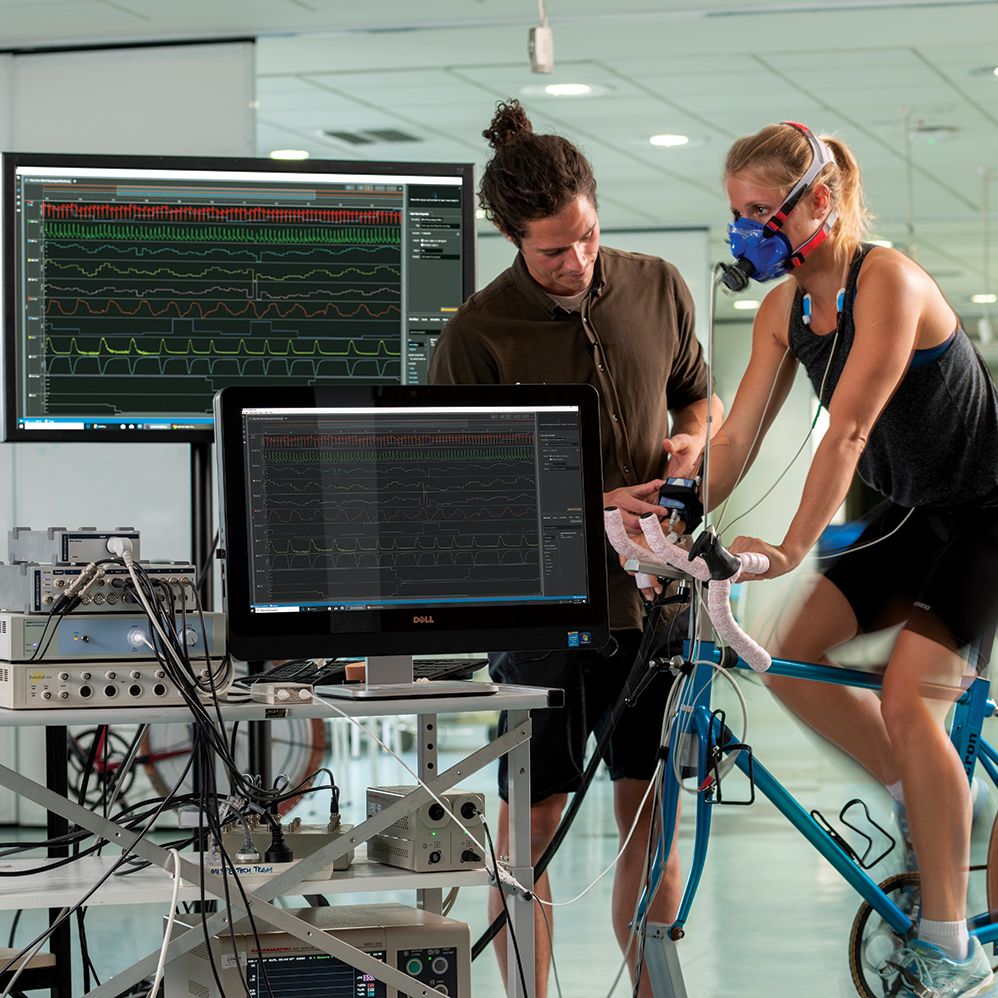
"The ability to overlay signals so you can see derived channels and keep an eye on critical signals is extremely valuable."
Professor Jim Cotter, School of Physical Education, Sport and Exercise Sciences, University of Otago.

Just the beginning
LabChart Lightning is the latest iteration of our 34 year history of creating easy to use data acquisition and analysis software. LabChart Lightning empowers innovative researchers to make unique scientific discoveries with unlimited freedom and flexibility. The perfect software for ECG, EMG and EEG data acquisition and analysis, LabChart Lightning is a powerful tool for biosignal recording and both quantitative and qualitative data analysis.
![]()
Unlimited
channels
![]()
Cross-recording
analysis
![]()
Custom
calculations
![]()
Cross
platform
How is LabChart Lightning different?
LabChart Lightning runs on Quark, the same reliable and robust engine that powers LabChart 8. So not a lot has changed, except everything. LabChart Lightning has been completely re-imagined to focus on combining power, ease of use, and data integrity. This means that LabChart Lightning has some awesome new features like unlimited channels, cross recording analysis, custom calculations, and data management. LabChart Lightning also runs exactly the same version on both Windows and Mac. However, it does not yet have any of the extensions or modules that LabChart 8 has.
| LabChart Lightning | LabChart 8 | |
|---|---|---|
| PowerLab Integration | checkmark | checkmark |
| Data Management | checkmark | cross |
| Cross-Recording Analysis | checkmark | cross |
| Unlimited Channels | checkmark | cross |
| Custom Calculations | checkmark | cross |
| Cross Platform | checkmark | cross |
| History and Autosave | checkmark | cross |
| Light View and Dark View | checkmark | cross |
| Import/Export | checkmark | checkmark |
| Table view | checkmark | checkmark |
| Annotations and Regions | checkmark | checkmark |
| Readouts | checkmark | checkmark |
| Spectrum and Scope | cross | checkmark |
| Macros | cross | checkmark |
| Stimulation | checkmark | checkmark |
| Data Plots | cross | checkmark |
| Extensions | cross The calculations from some modules and extensions can be recreated in custom calculations. Please contact us for more information. | Audio Output, Cardiac Axis, Event Manager, Export QuickTime, Fast Response Output, Multipoint Calibration, Non Invasive Cardiac Output, Scheduler, Spirometry, Telegraph. |
| Analysis Modules | Blood Pressure, Cardiac Output, DMT Normalization, Dose Response, ECG Analysis, HRV, Metabolic, Peak Analysis, PV Loop, Spike Histogram, Video Capture. |
LabChart Lightning Licenses
LabChart Lightning’s user-based online licensing allows you to log in and use Lightning wherever you are, while offline licensing allows you to assign a license to a computer for longer-term or offline recording. The new license group administration features put licensing into your own hands, allowing you to assign or revoke licenses within your group and maintain control over license usage.
Licensing Model
Licensing
- A LabChart Lightning license exists forever.
- Licenses are assigned to individual users and can be reassigned to new users.
- Users can log in to LabChart Lightning on any computer that has it installed.
- LabChart Lightning can be installed on an unlimited number of computers.
- You can purchase licenses individually or at a discounted rate in bundles of 5.
Hardware Bundles
- 2 LabChart Lightning licenses are included when you purchase a new 26 Series or PowerLab C.
- 3 additional licenses can be added at the time of purchase at a discounted rate.
New Features and Upgrades
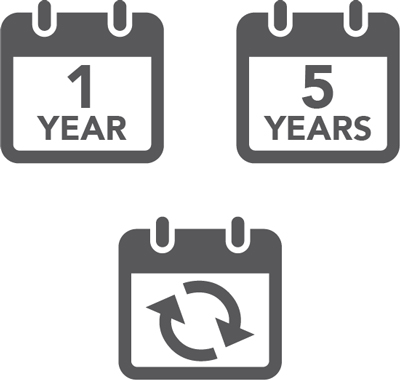
- All LabChart Lightning users will receive 1 year of upgrades for free.
OR
- Users can prepay for 5 years of upgrades.
OR
- Users can sign up for an annual subscription to receive continual upgrades.
For more information contact your local ADInstruments representative.
"If you enjoyed using LabChart 8, you're going to love Lightning, as it offers even more flexibility and customization."
Brandon Bucher, Head of Research, ADInstruments.
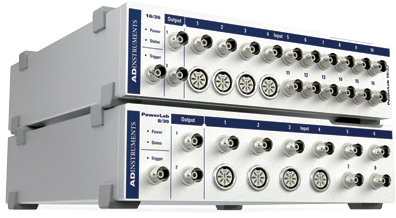
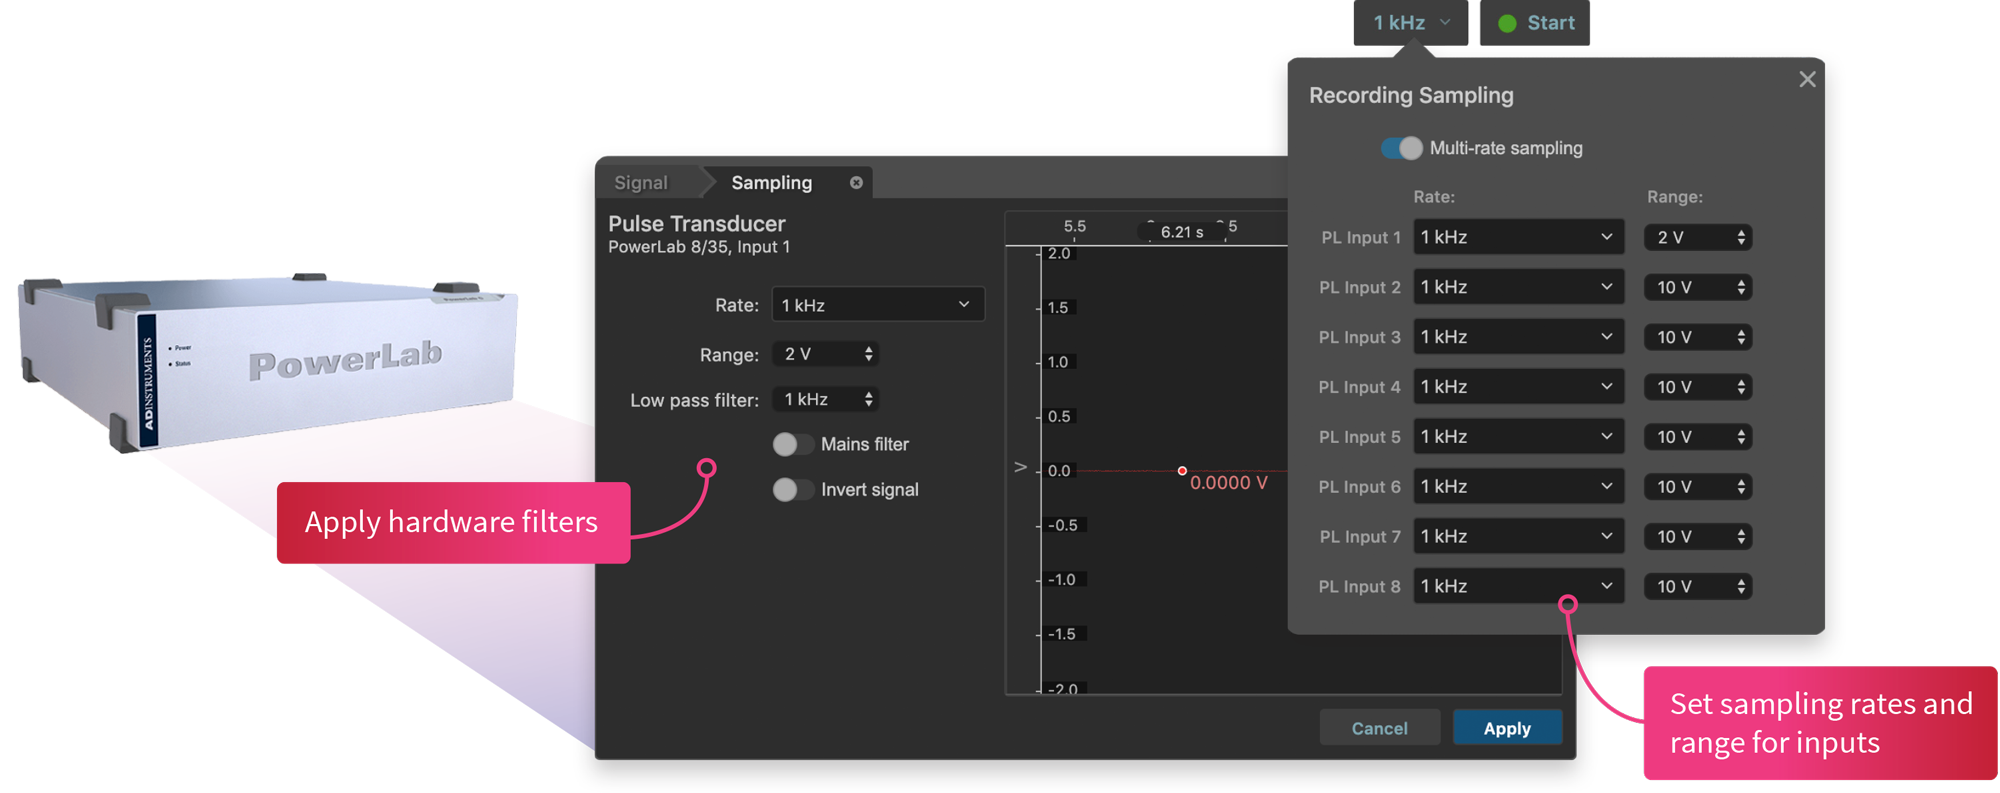
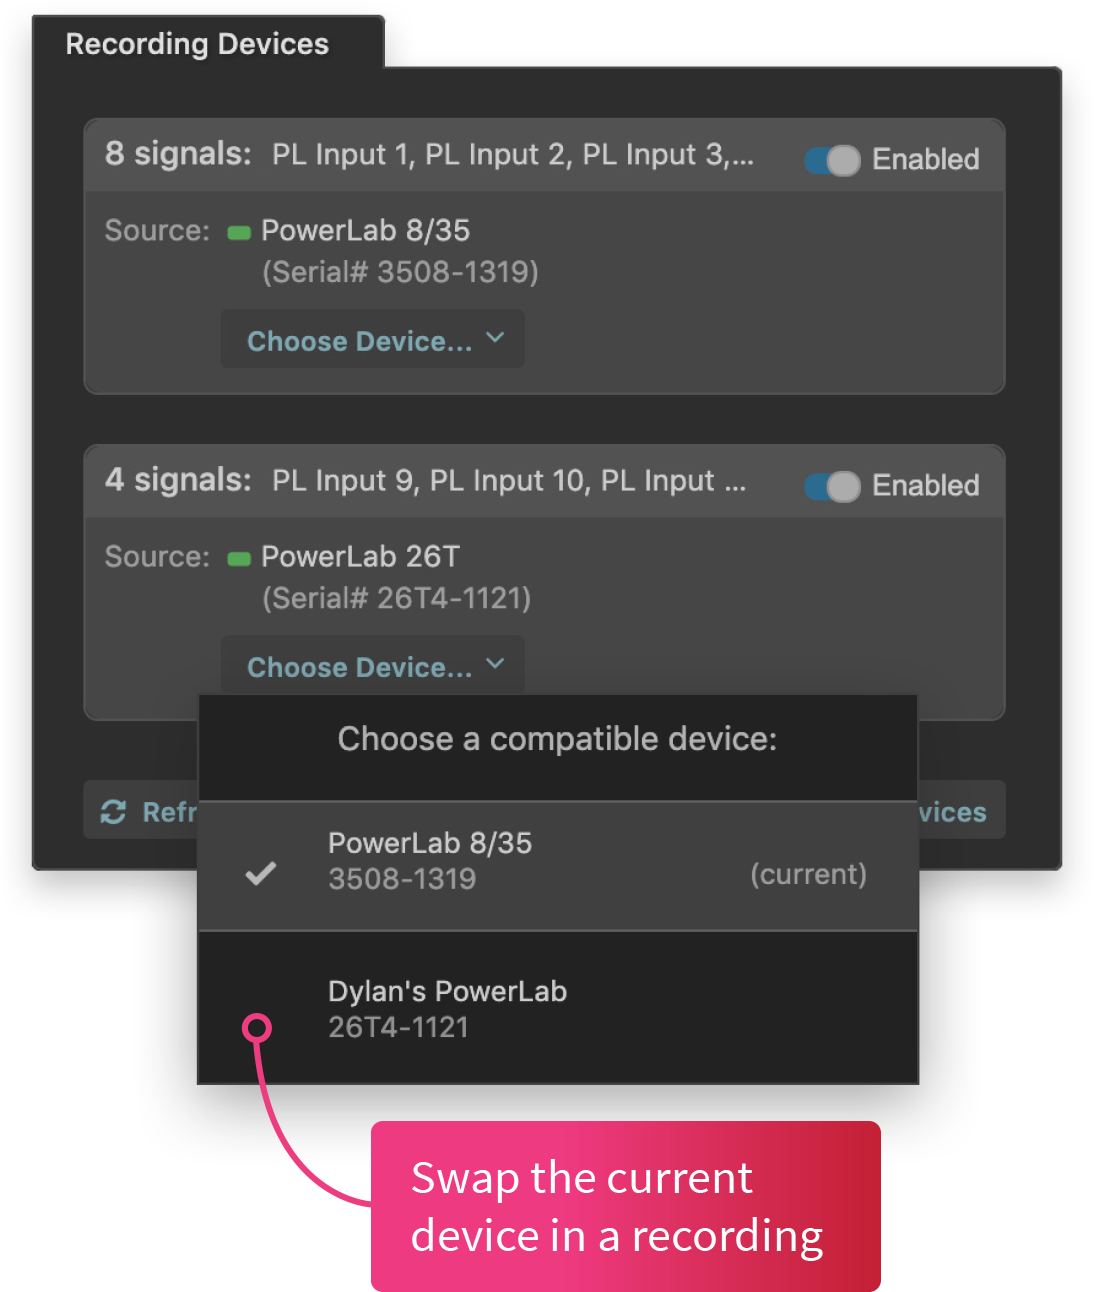
PowerLab Integration. Start and stop recording ECG/EKG, EEG, EMG and other biological data from PowerLab and ADInstruments amplifiers. Control hardware settings and filters from within LabChart Lightning.
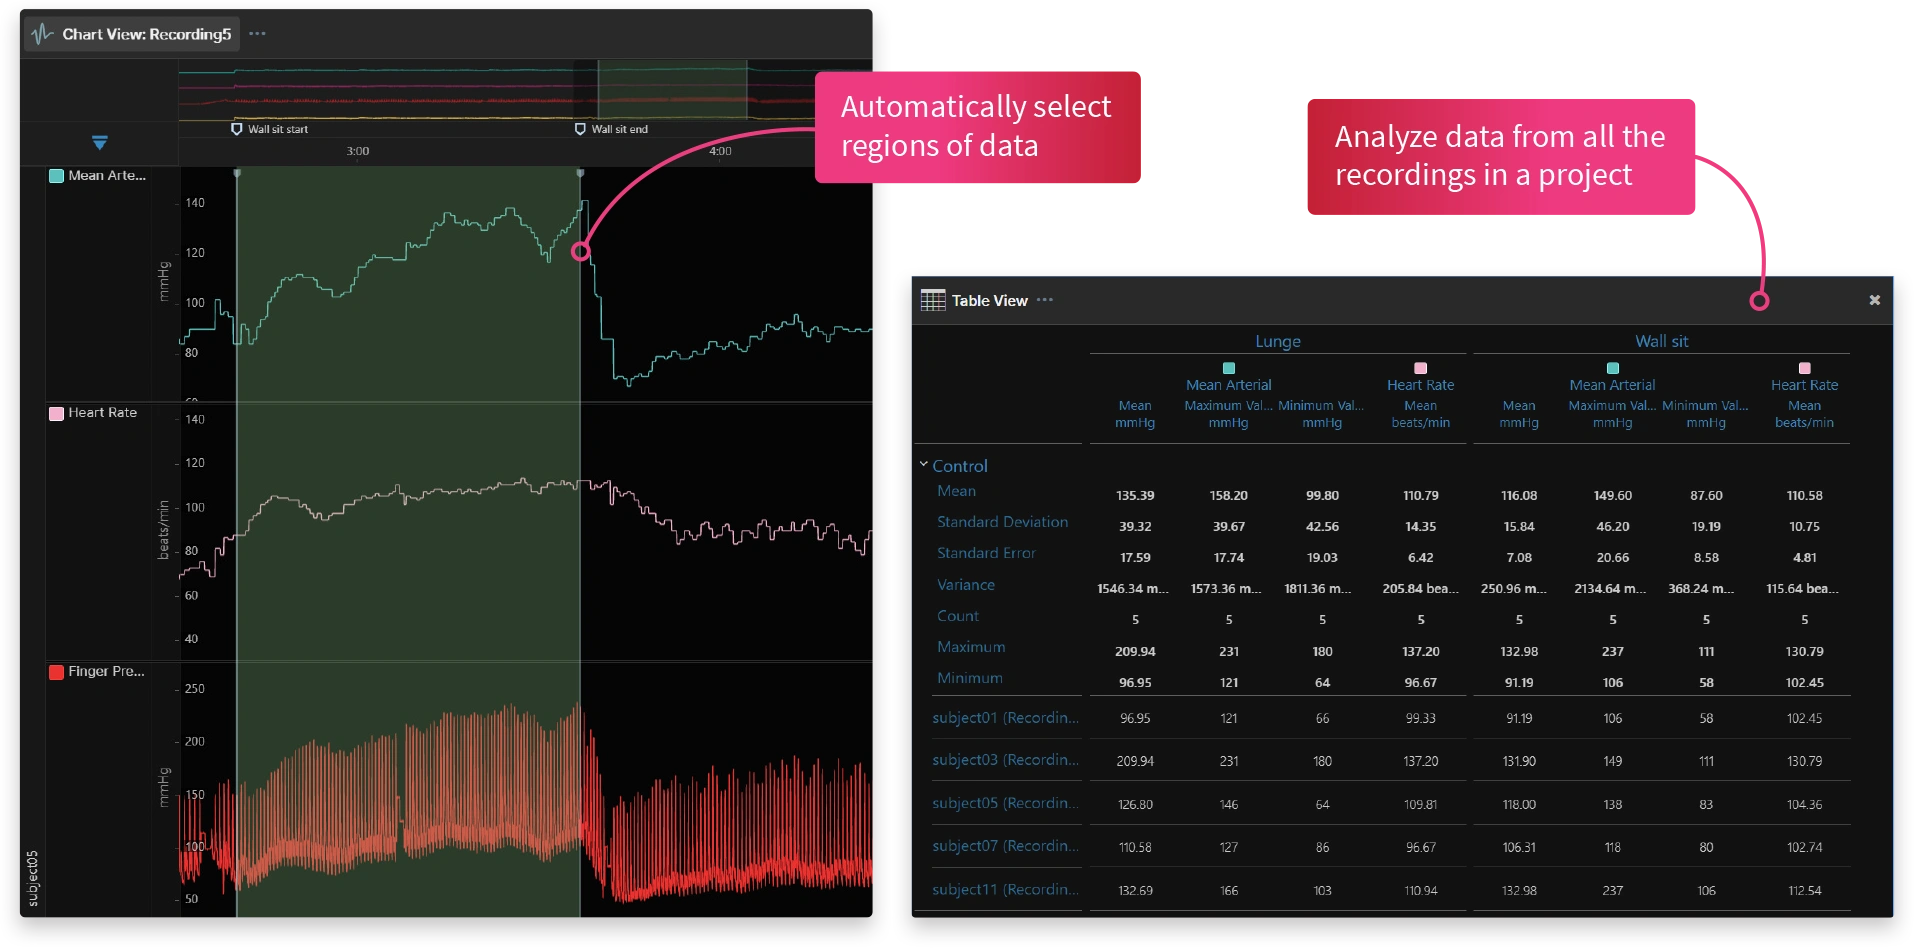
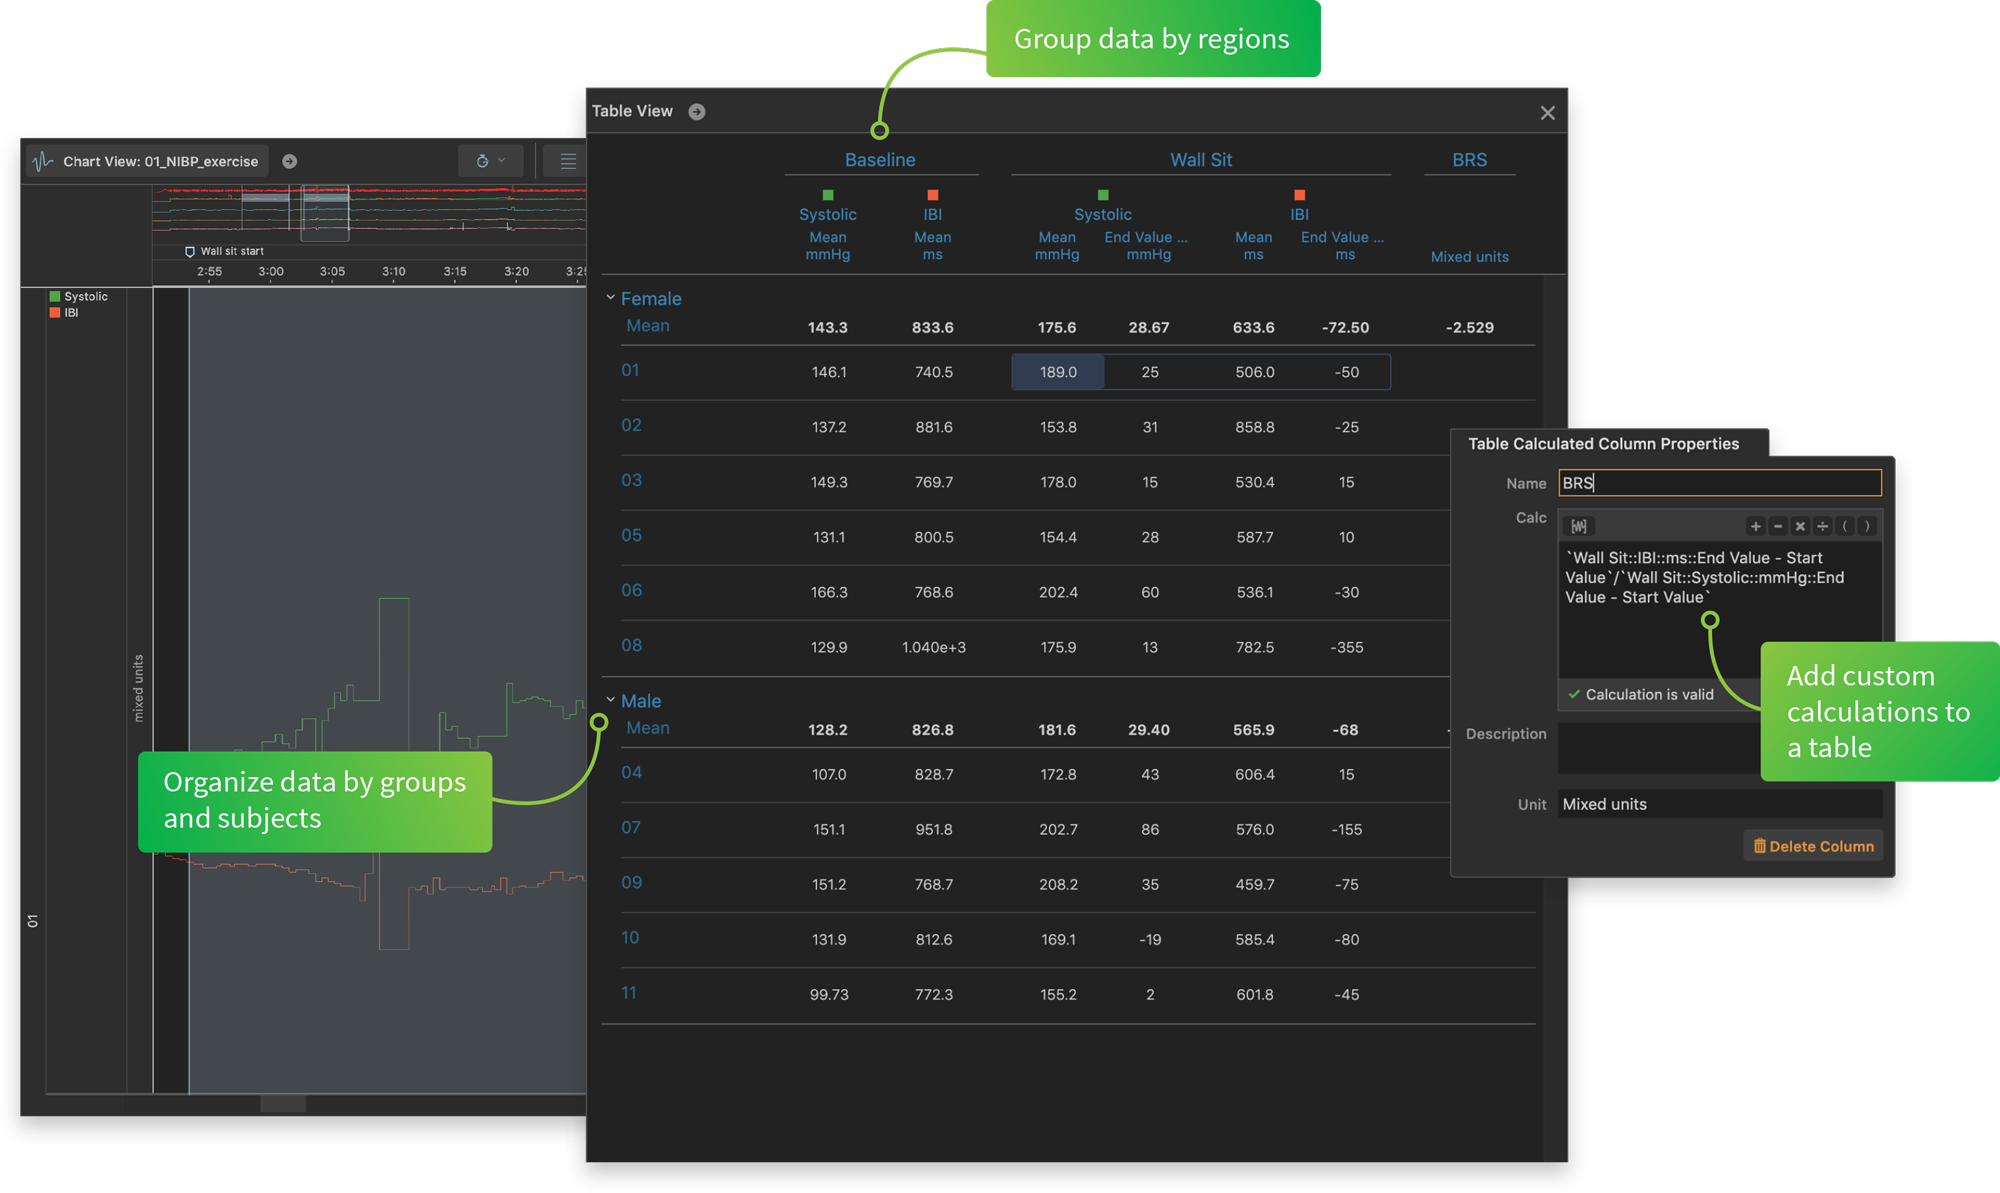
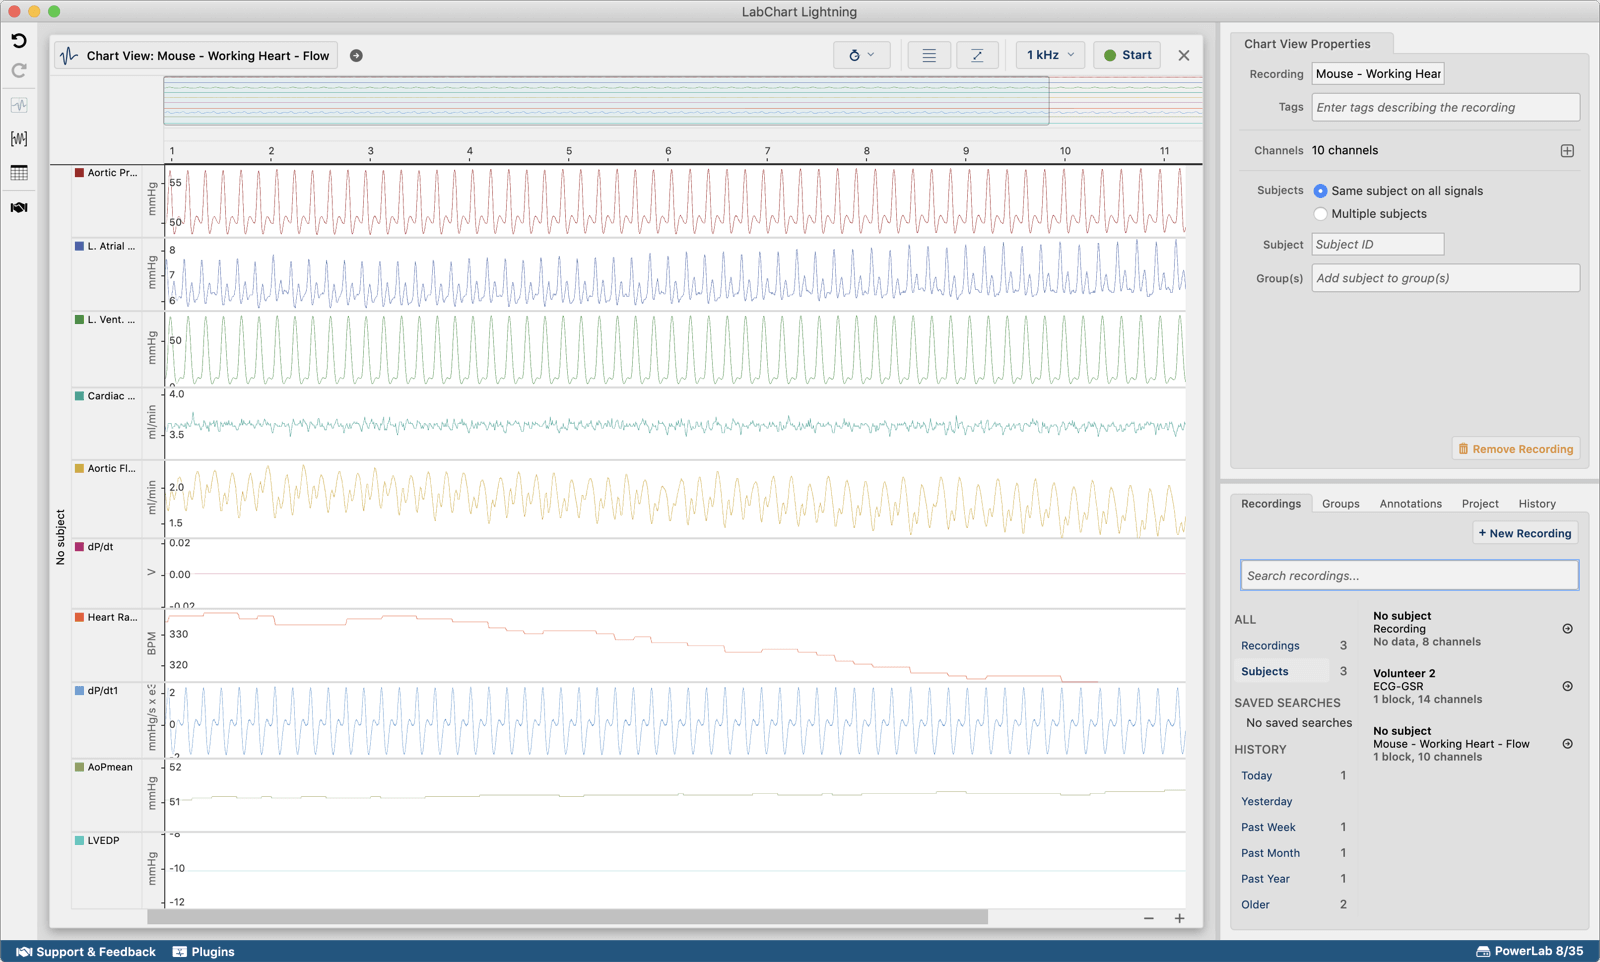
Data management. Organize your recordings within projects. Assign signals to subjects and groups within a project. Select regions of data for cross recording analysis.

Cross recording analysis and Table View. Analyze data across multiple biosignal recordings within a project. Organize recordings and channels by subjects or groups. Convert time based data from recordings to discrete values to use in statistical analysis.
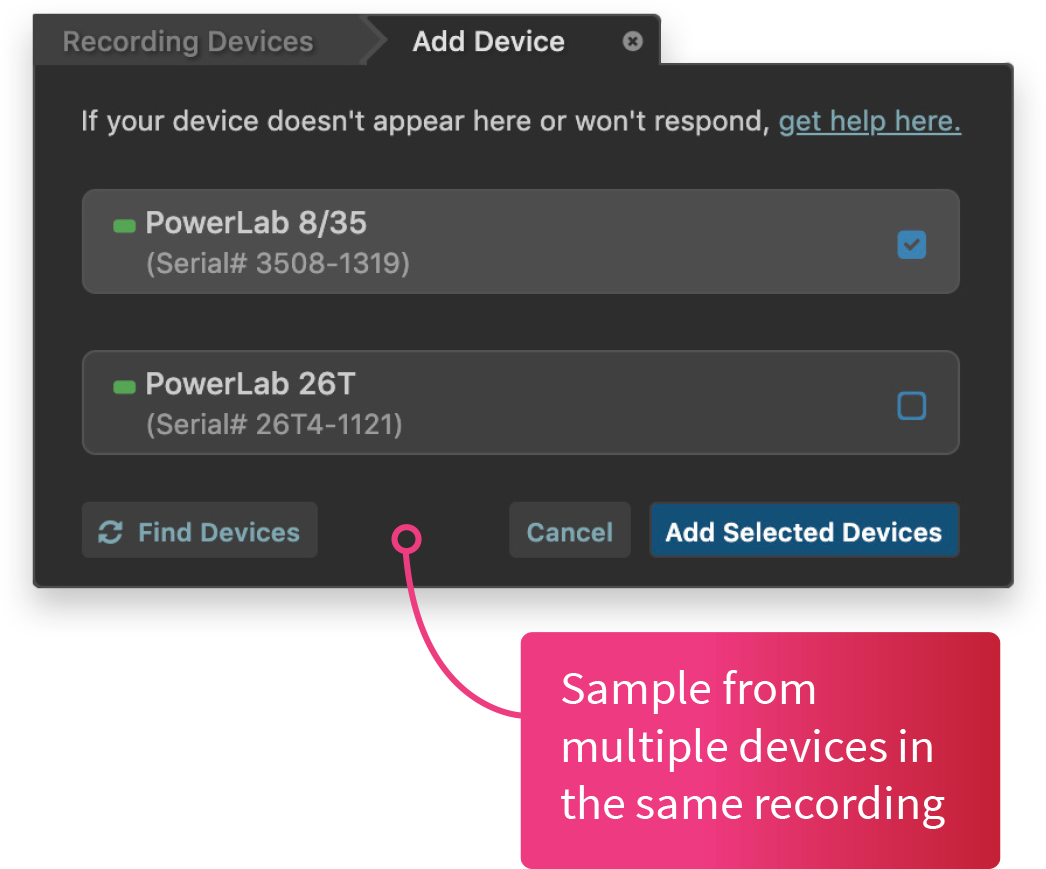
Unlimited channels and multiple device support. Record data into an unlimited number of channels and create as many calculated signals as you like. Sample from two or more PowerLabs, third-party devices, or a combination of both in the same recording.
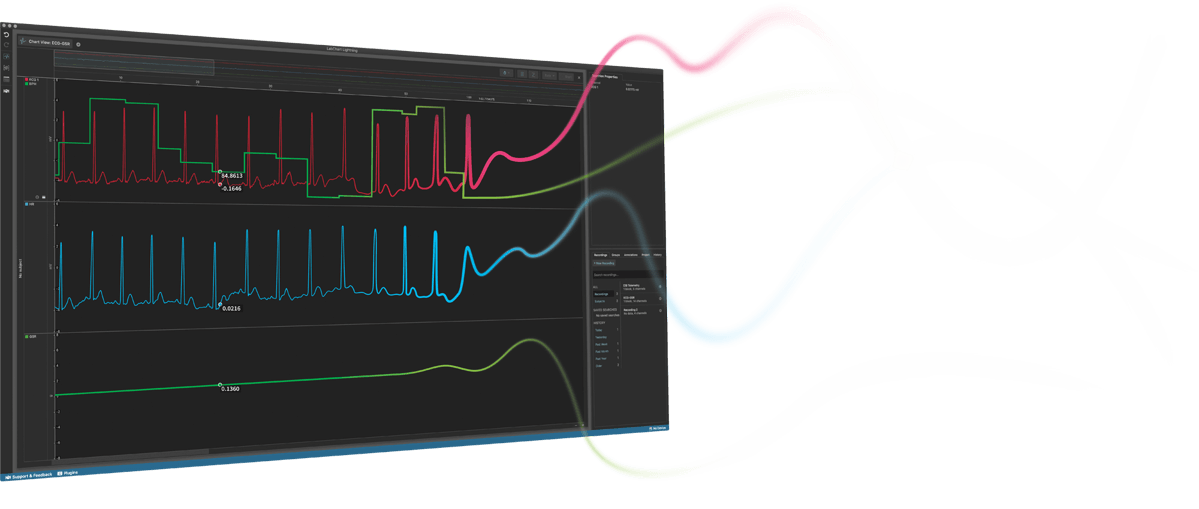
Overlaid signals. Overlay signals by dragging and dropping them between channels.
Dark view and light view. Switch between dark and light view. Dark view makes it easier to look at your screen for long periods of time in low light environments.
Custom calculations. Create custom calculations by dragging and dropping functions from our extensive function library. See the effect of custom calculations on your original data to optimize your calculations. Share your calculations with colleagues.

Cross platform. Run exactly the same version of LabChart Lightning on both Windows and Mac.

History and autosave. Every change to a project and recordings is automatically saved and logged in the project history. Easily revert to previous versions of your project using the history feature.
Automatic region generation. Automatically select relevant regions of data for analysis. Analyze data across multiple biosignal recordings within a project.