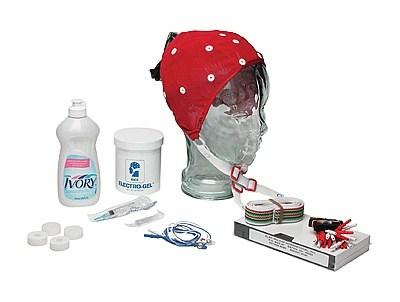
Record the electrical activity of the brain that occurs between pairs of electrodes in contact with the scalp and represents the sum of a large amount of underlying neural activity.
ADInstruments offers a comprehensive and easy-to-use solution for visual stimulus presentation and evoked response studies to study behavioral and cognitive neuroscience, and decision-making. With the combination of SuperLab and StimTracker from Cedrus with PowerLab and LabChart, you can create an integrated system with simple media management, tracking and complete control of your research data.
Our human approved stimulus isolators also allow for studies requiring electrical stimulation of nerves. PowerLab can also interface with other types of stimulators, such as TMS machines for non-invasive brain stimulation.
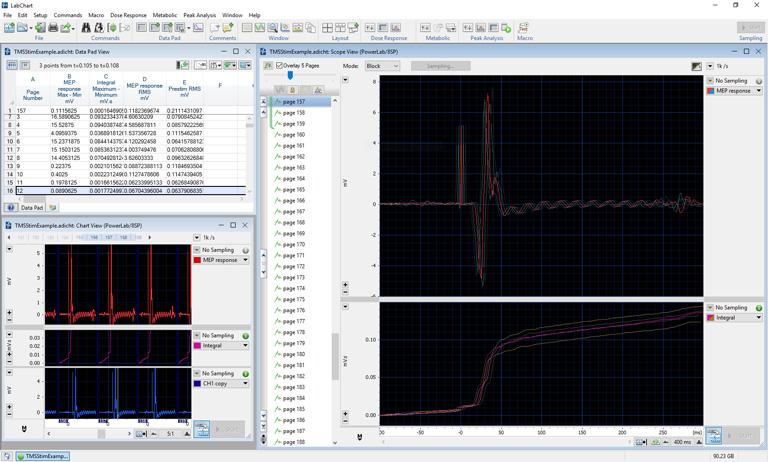
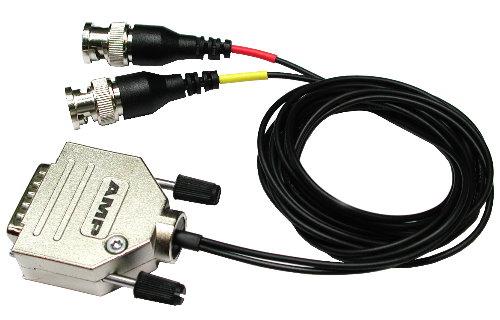
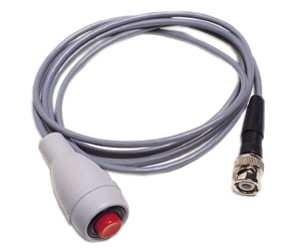
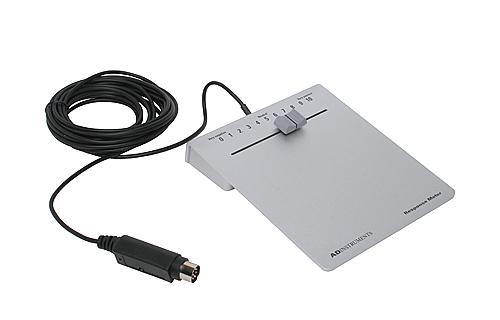
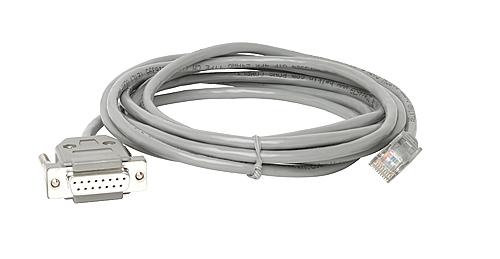
In conjunction with our solutions shown below, any device with an analog output (+/- 10V) can be connected to a PowerLab data acquisition system for synchronization of the event in LabChart, giving you more flexibility and the ability to integrate your data streams in one place.
All our hardware recommended for human use is backed by the appropriate safety certification standards. More information on safety standards.
Response or reaction times (RT) and duration
Conscious response types (positive or negative)
Evoked responses (biopotentials, EOG, EEG, EMG)
Subconscious responses (heart rate, breathing rate)
Biofeedback
Stress Response
Reaction times
Sensory perceptions & Illusions
Classic conditioning
Operant conditioning
TMS Studies
Record the electrical activity of the brain that occurs between pairs of electrodes in contact with the scalp and represents the sum of a large amount of underlying neural activity.
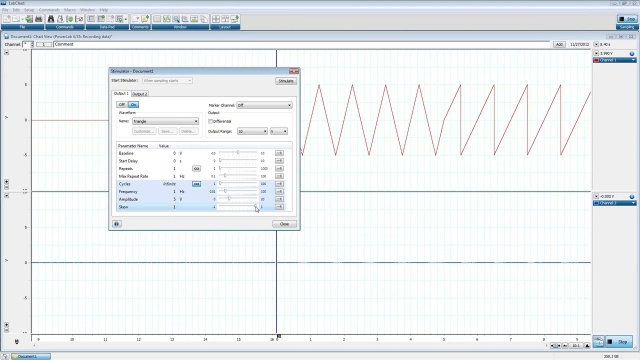
Measure electrical stimulation and pacing in human subjects.
Electromyography (EMG) is the study of muscle electrical activity. Useful in recording reflexes and reaction times through to fine facial movements in response to stimuli.
Eye movements can be recorded using electrodes placed in the skin near the eyes. This includes such as tracking moving objects, fixating on stationary objects while the head moves, or measuring the direction and size of eye movements.
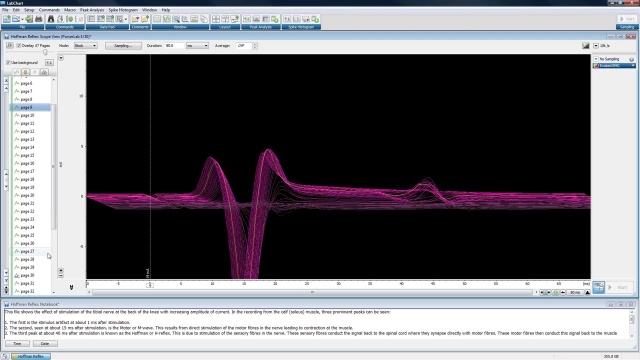
Sample single or multi-unit spikes. Sort and analyze these signals with LabChart’s Spike Histogram Module. Your LFP and Evoked potentials can be analyzed using Peak Analysis.
Options for both wireless and wired recording of heart rate as a reference to changes in cognitive and emotional states.
Trigger sounds played to participants during the experiment and record responses.
Temperature is a useful tool in determining many factors such as subject health or the stability of an experimental preparation. It is also usefulas a calculation factor for comparing measurements taken in different states.
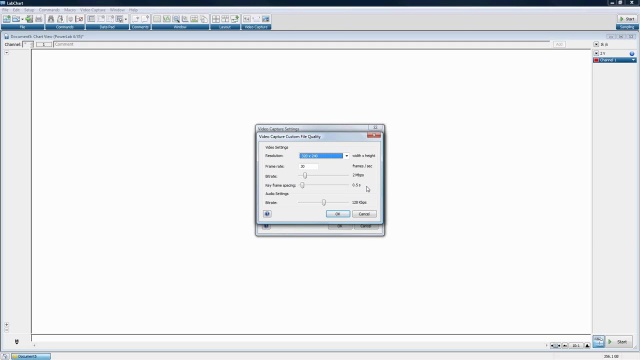
Simultaneously record and synchronize video to observe video and physiological data together.
ADInstruments systems provide an integrated solution to advance life science research. With the combination of LabChart or LabChart Lightning analysis software and a PowerLab data acquisition unit, you have the flexibility to collect and synchronize a wide range of signals for analysis. We also offer a range of LabChart compatible solutions able to stream directly in LabChart.
Enabling Discovery
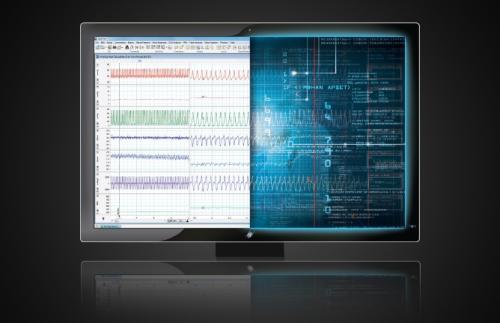
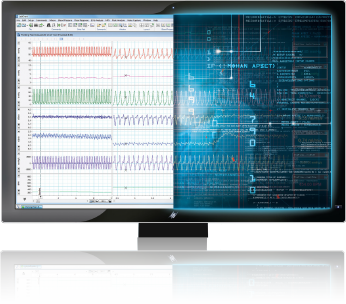
LabChart data analysis software creates a platform for all of your recording devices to work together, allowing you to acquire biological signals from multiple sources simultaneously and apply advanced calculations and plots as your experiment unfolds. Learn more about LabChart and Stimulation »
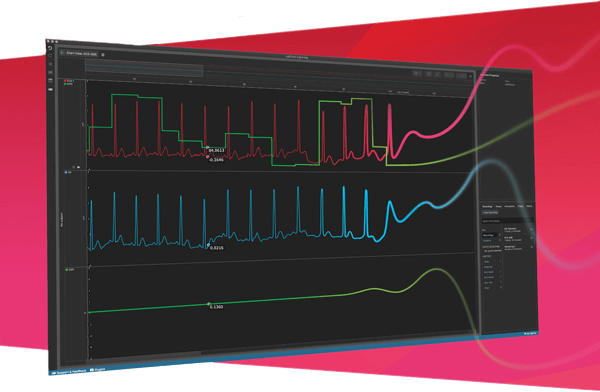
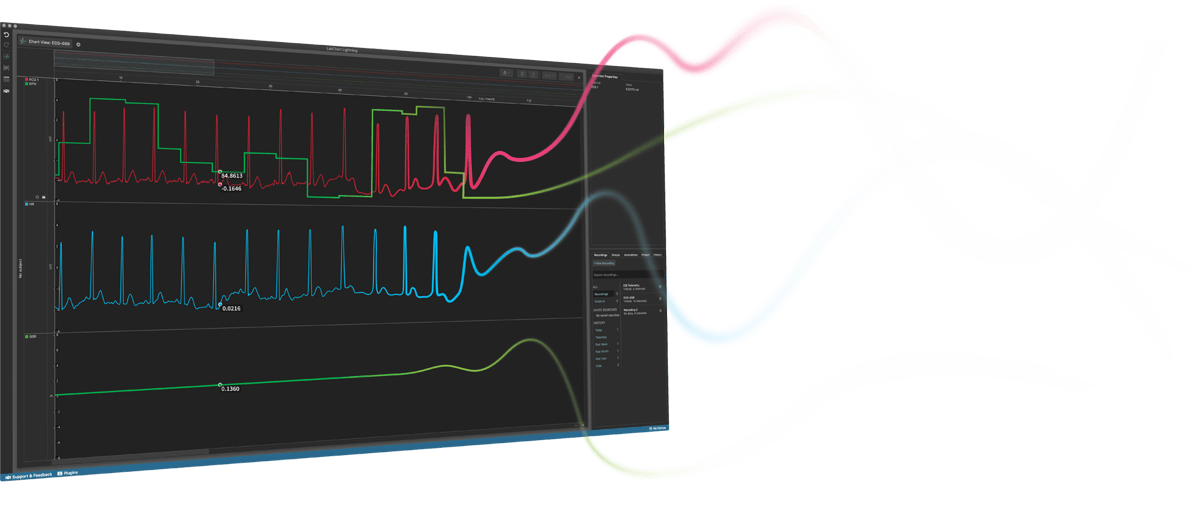
Data acquisition and analysis re-imagined. Make unique discoveries with unlimited freedom and flexibility. Try LabChart Lightning »
Data with Integrity
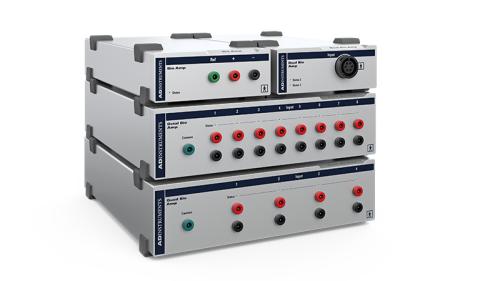
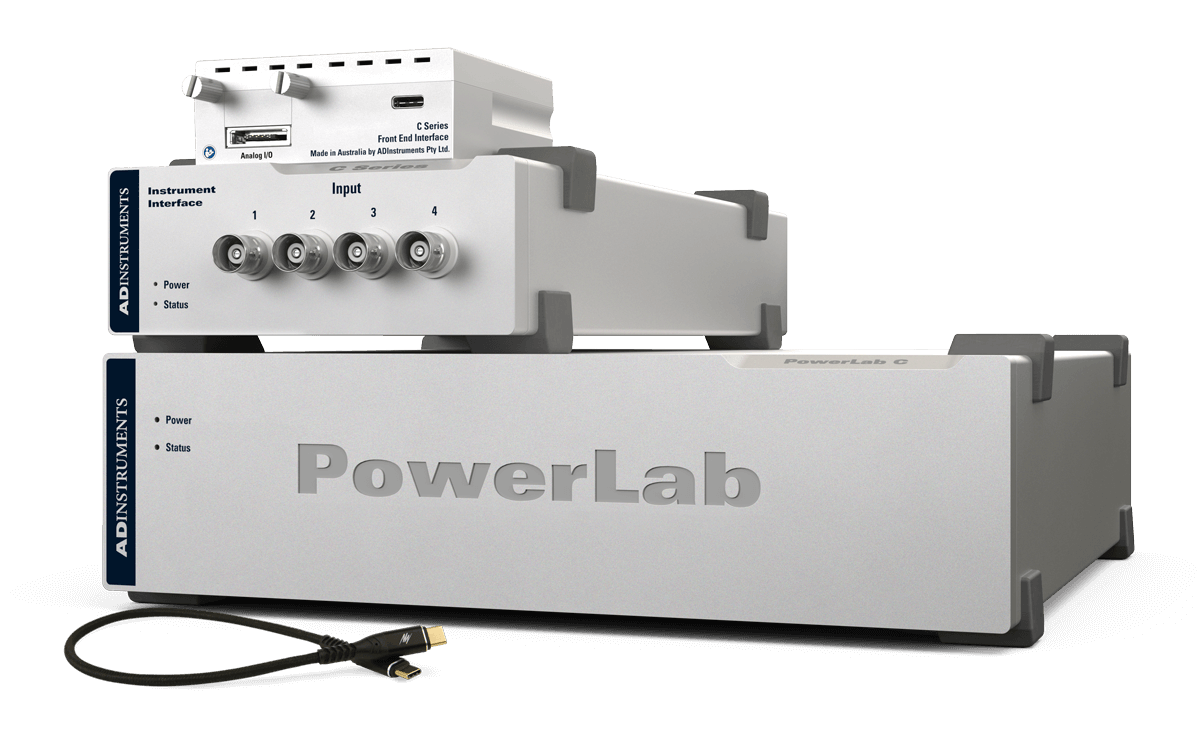
High-performance data acquisition hardware designed for life science research. PowerLab is engineered for precise, consistent, reliable data acquisition, giving you the reproducible data you need while meeting the strictest international safety standards. Learn more »
Re-engineered for
unparalleled flexibility
A modular data acquisition foundation system that provides unparalleled flexibility for researchers looking to invest in customizable, reliable solutions for both now, and in the future. Learn more »
LabChart software is designed specifically for life science data and provides up to 32 channels for data display and analysis options that are powerful and easy to use. With auto-recognition of ADI and LabChart Compatible hardware, multi-window views, one touch recording, simultaneous recording from multiple devices, specialized preconfigured settings, easy sharing options and an interface that can be customized to show only the features you want to use.
Additional acquisition and analysis features and add-ons to support your Stimulation studies:
The average human reaction time is about 150 ms to touch, 170ms for auditory stimulus and about 250ms for visual stimuli. However, many factors can affect an individual reaction time to stimulus. Examples that are often tested as variables in psychophysiology experiments include:
Thank you for your interest in Stimulation. Please complete and submit the form below and an ADInstruments representative will aim to get in touch within one working day. If you’d like to speak to someone immediately, office contact information is available from the contact page.
×Thank you for your interest in Stimulation. Please complete and submit the form below and an ADInstruments representative will aim to get in touch within one working day. If you’d like to speak to someone immediately, office contact information is available from the contact page.
×