The HRV Module provides great tools and algorithms for analyzing heart rate variability in ECG recordings or arterial pulse signals. This Software Tip shows how you can take advantage of built-in LabChart 8 features, such as Data Pad Plots, to extend your analysis by tracking certain HRV statistics over time.
Let’s track LF/HF over time. This is the ratio of sympathetic to parasympathetic activity in the heart. This is useful as an indicator of the overall balance between the two systems. This statistic is particularly of interest to researchers when performing segmented analysis.
You first need to set up the Data Pad accordingly.
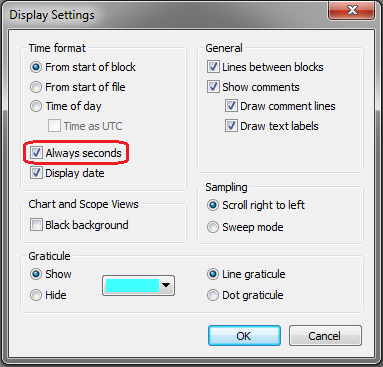
The display settings need to be slightly modified so that the Time column will look nicer in Plots. Tick Always seconds.
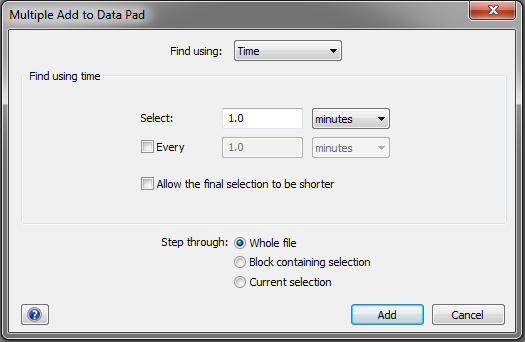
Next, data needs to be added to the Data Pad in order for it to be plotted. This can be achieved using Multiple Add to Data Pad when performing offline analysis, or Timed Add to Data Pad while sampling.
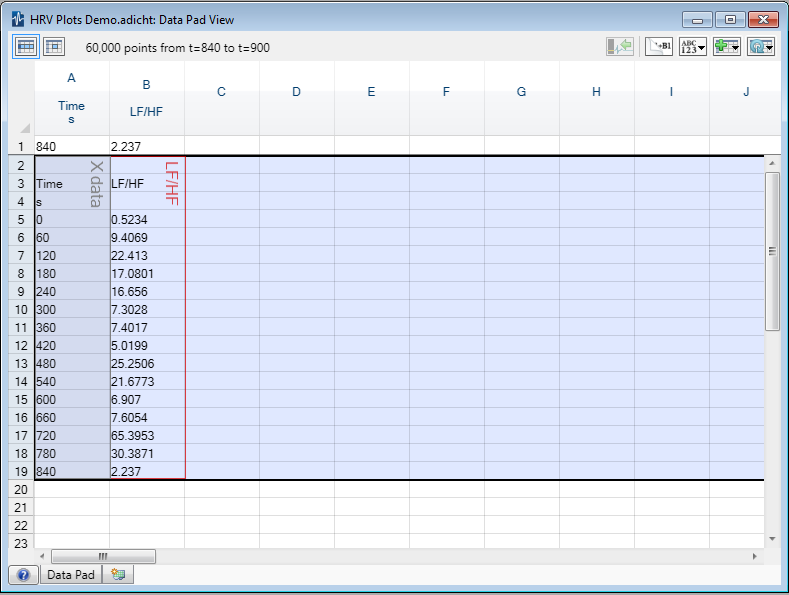
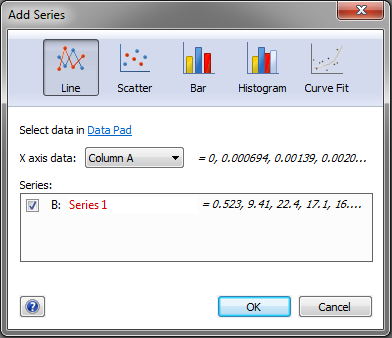
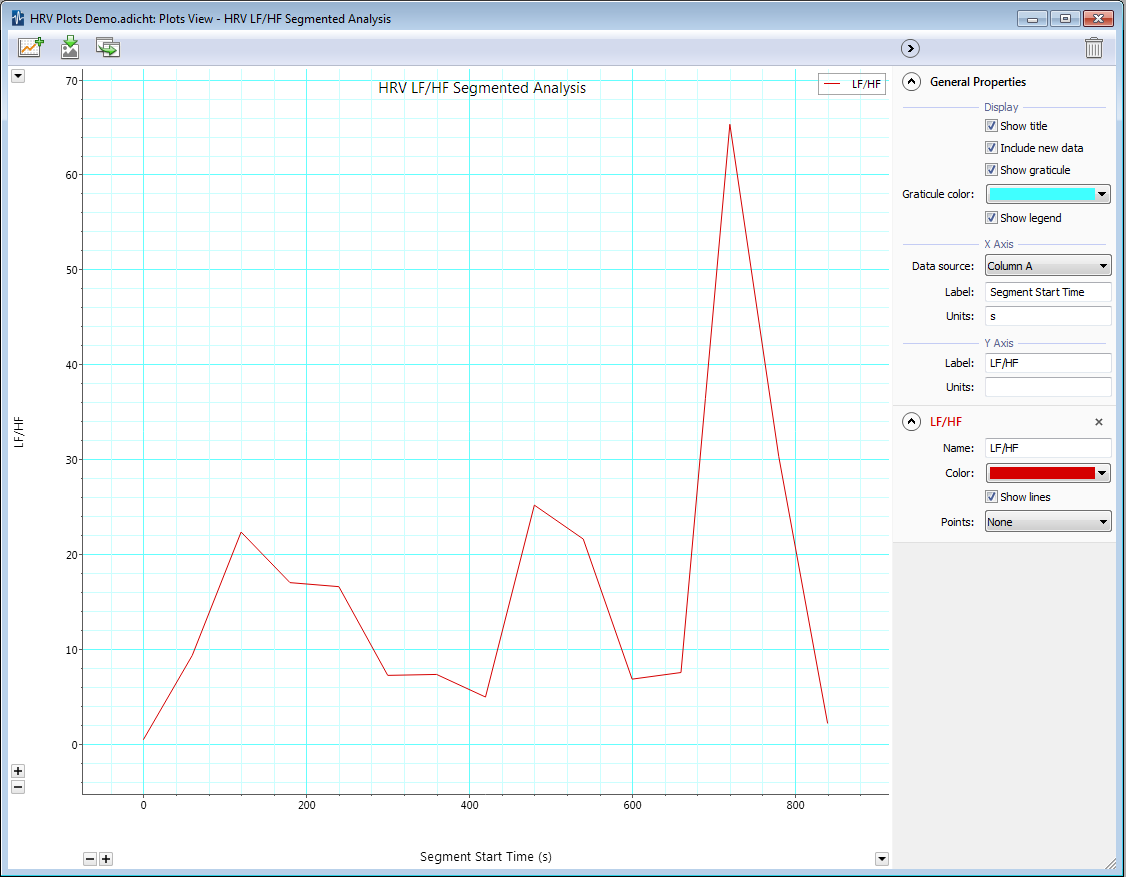
Once you have your data in the Data Pad, you can graph it in Plots. This is as simple as selecting the data, right-clicking and selecting Create Plot. Remember to make sure that the X axis data is set to your Time column.
To produce a plot ready for publishing, we can give it an appropriate title and correctly label the time axis.
This tip has described how Data Pad Plots can be used to extend a LabChart module to provide extra analysis that could not be easily achieved otherwise.
You can replicate the steps in this tip using the HRV Demo file.