European scientists are using PowerLab systems to synchronize experiment protocols and monitor subjects as they develop new ways of observing the effects of airway challenges on lung function and ventilation distribution. Their innovative Synchrotron Radiation CT Imaging research was recently featured on the cover of the American Journal of Respiratory Critical Care Medicine.

The team is made up of researchers from institutions across Europe including:
- University of Picardie/University Hospital of Amiens, France
- University of Helsinki, Department of Physical Sciences/University Hospital (Finland)
- Geneva Children's Hospital (Switzerland)
- University of Szeged (Hungary)
- European Synchrotron Radiation Facility (France)
What is Synchrotron Radiation Computed Tomography?
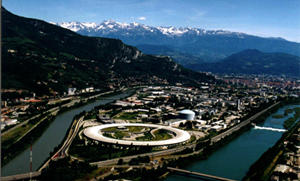
SRCT is a form of computed tomography, an imaging method commonly referred to as CT scanning. SRCT uses Synchrotron Radiation (SR) as its light source. SR is much brighter than an ordinary X-ray or CT scan light source, and creates much higher resolution images with microscopic spatial resolutions. The team are performing their experiments within the Biomedical Beamline at the European Synchrotron Radiation Facility in Grenoble France, the most powerful synchrotron radiation source in Europe (pictured above right).
How Are the Researchers Using SRCT in Ventilation Studies?
The team are interested in lung function and mechanics. Specifically, they want to know more about how different lung regions behave during an airway challenge such as an asthma attack or allergic reaction. SRCT is ideal, as the short image acquisition time makes in vivo functional imaging possible, and the images are so high-precision that they can be used for quantitative studies.
The team is using K-Edge Subtraction (KES) Imaging to measure regional lung ventilation. This technique determines regional pulmonary ventilation from the wash-in and wash-out rates of inhaled non-radioactive xenon in a sequence of images.
The paper in American Journal of Respiratory Critical Care Medicine reported on a study where the team used SRCT imaging in combination with low-frequency forced oscillation techniques to assess mechanical lung parameters and regional lung ventilation in rabbits simultaneously. The goal of the study was to determine whether the mechanism of airway challenge is involved in the heterogeneity of response in the bronchial tree.
The researchers began by ventilating each subject, and taking a series of baseline images and recordings (measuring parameters including respiratory rate, airway pressure and arterial pressure). They then intravenously administered methacholine, an agent that acts on smooth muscle cells to constrict the airways. Following a thirty minute recovery period, they administered ovalbumin, a protein that causes an allergic reaction in the previously sensitized subjects.
Images of the subject's lungs were acquired during each intervention and the recovery period. The imaging sequence began by switching the inhaled gas from air to a xenon and oxygen mixture. To avoid movement artefacts, images were acquired during a three second pause in ventilation.

How are they Using PowerLab?
For safety reasons, scientists control mechanical ventilation, image acquisition and the synchrotron radiation optics from an adjacent room during SRCT. The researchers use the PowerLab system to ensure that image acquisition is synchronized with respiration pauses.
"The PowerLab system is essential in monitoring in vivo experiments and making sure the computer synchronization is working properly at all times," says Dr Sam Bayat, one of the researchers.

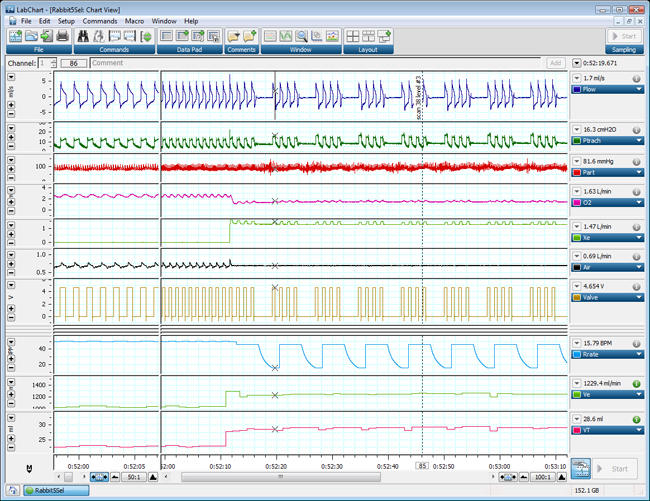
The LabChart screen capture above is from a typical experiment conducted by the group. As well as physiological parameters used to monitor the experimental subject (such as airway pressure in Channel 2 and arterial pressure in Channel 3), LabChart also records the performance of parts of the equipment setup on the same time axis.
For instance, three channels record the gas flows of air (Channel 6), oxygen (Channel 4) and xenon (Channel 5) in the ventilation system. These waveforms reflect the switch from using air in resting periods to using a combination of xenon and oxygen during the imaging cycle in order to enable the K-Edge subtraction imaging. Channel 7 records the opening and closing of the valve used to control the subject's inspiration and expiration. The researchers have also added a Comment across all channels annotating the data to include where an image was taken.
What Are the Results?
In the American Journal of Respiratory Critical Care Medicine article, the researchers combined the results from the KES Imaging (offering simultaneous measurements of the changes in the calibre of conducting airways and regional lung ventilation), with the functional changes measured by the low-frequency forced oscillation technique.
Although both methacholine and ovalbumin provoked similar increases in airway resistance, they caused radically different changes in the airways and lung peripheries. Intravenous methacholine mostly affects the central airways, and causes only minor changes in the lung periphery.
In contrast, during the ovalbumin intervention, both the mechanical and the functional imaging parameters indicated the development of severe ventilation heterogeneity and airway closure in the lung periphery.
Interestingly, when the researchers administered methacholine through a nebulizer, so the subjects inhaled the agent (rather than receiving it intravenously), it produced a similarly "patchy" ventilation effect to the intravaneously administered ovalbumin.
These results indicate that both the mechanism and route of airway challenge affect the heterogeneity of airway response. According to Dr Bayat, "these findings may have important implications for further understanding of asthma disease mechanisms and drug-targeting strategies in this disease"