Spike Histogram
Spike Histogram Analysis
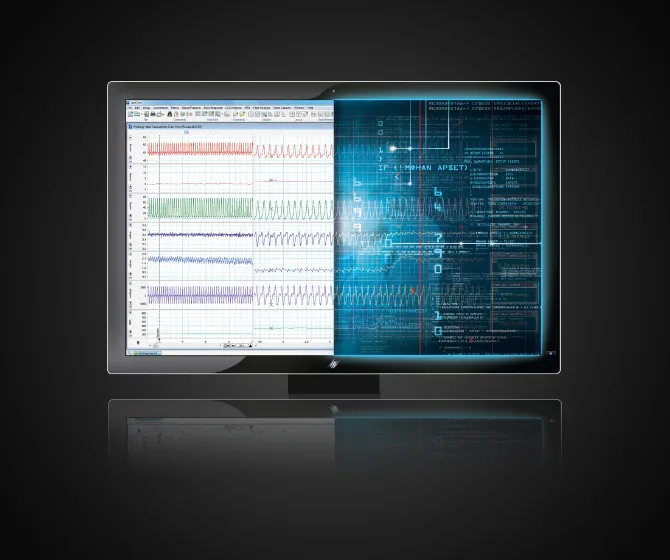
The Spike Histogram Module for LabChart provides the ability to record and analyze extracellular spike data in real time.
Download SoftwareOverview
The Spike Histogram Module for LabChart provides the ability to record and analyze extracellular spike data in real time.
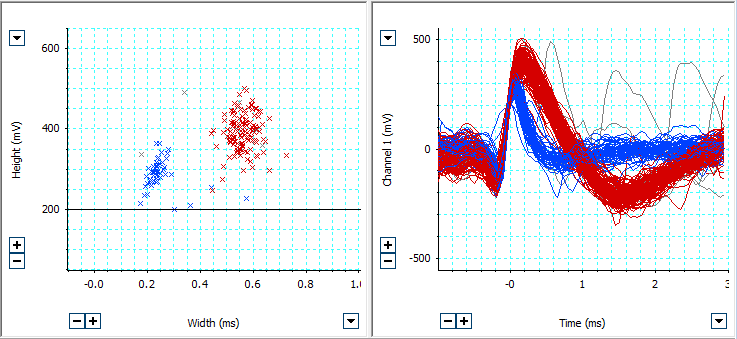
The extracellular analysis software allows quick and easy discrimination and analysis of extracellular neural spike activity using two discrimination methods. Discriminated spikes can be viewed in specialized histogram windows including amplitude histogram, rate meter, peristimulus histogram, autocorrelogram and more.
The Spike Histogram Module is included as part of LabChart Pro or can be purchased separately.
Related
Research Applications
Human Autonomic
Evoked Responses and Stimulation
Animal Neuroscience
Video Capture
Animal Neuroscience
Nerve Recording
Animal Autonomic
Signals
Key Features
- Advanced spike discrimination and data analysis in real time or after recording.
- Two discrimination methods
- Fast and easy template matching for spike discrimination or
- Freehand contour drawing for precise selection of spikes
- Automatic indication and examination of changes in neural firing rate.
- Multi-channel, multi-unit analysis allows comparison of any physiologic measures recorded.
- Channel calculations displaying properties of the defined unit(s) such as frequency.
- Spike Histogram Settings dialog allows
- Data source selection
- Extracted waveforms detection threshold, pretrigger and total trigger period
- Template matching options
- Spike units defined in the Discriminator View window can be used as an Event Source in Scope View. Spike triggered averaging can be performed by setting up averaging using time-based occurrence of spikes.
- Six specialized histogram windows:
- Rate Meter plots the spike firing rate against time
- Amplitude displays a histogram of spike amplitudes from different populations
- Interspike Interval displays a histogram of interspike intervals distribution
- Peristimulus Time Histograms examines changes in neural firing rates due to a repeated stimulus
- Autocorrelation Histogram detects periodicity in an individual unit or any inherent periodicity in spike
- Cross-correlation Histogram detects periodicity or temporal dependence of two physiologic parameters
- Ability to export data into NeuroExplorer® for further analysis of spike trains. NeuroExplorer provides an extensive set of spike train analysis options and histograms including burst analysis, spectral analysis and Poincaré maps.
Support
Support Articles
Our Support Articles contain answers to common questions, how-tos, solutions, and documentation.
Training and Workshops
Maximize time and resources with our customized training services delivered at your facility, on your equipment, on your terms.
Details and Tech Specs
Technical
Compatibility
LabChart 8 for Windows | checkmark |
LabChart 8 for Mac | - |
LabChart 7 for Mac | checkmark |