Nerve Recording
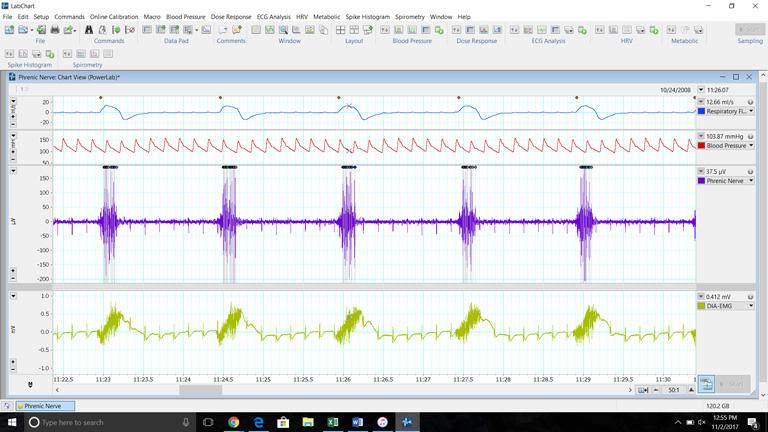
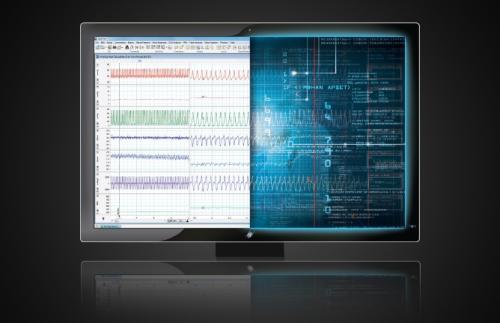
Recording peripheral nerve traffic is a main component of many autonomic studies as these signals reveal how the nervous system directs organ regulation and function. Using either acute, anesthetized preparations or implanted wireless telemetry - and whether recording from the vagal, splanchnic, lumbar or another nerve location - LabChart can help isolate SNA bursts from background noise and electrical and movement artifacts. In LabChart Lightning, the Stimulator Burst features allow you to set up evoked response protocols easily.
If your research looks at the neural control of respiration, our gas analyzer is ideal for studies using rodents.
With flexible research solutions, you can analyze your nerve recordings in depth and in conjunction with any additional physiological data, all on one platform.
Record multiple
signals at one time
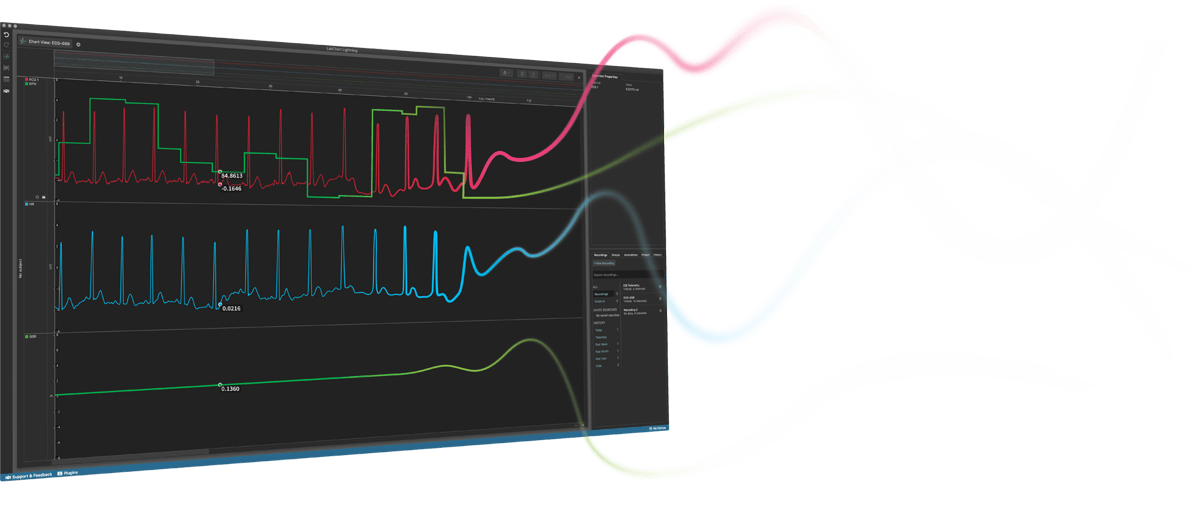
Compare nerve
recordings with physiological
function
Mix and match
products for a custom solution
Integrate your data
streams in one place
In conjunction with our solutions shown below, any device with an analog output (+/- 10V) can be connected to a PowerLab data acquisition system for synchronization of the event in LabChart, giving you even more flexibility and the ability to integrate your data streams in one place.
All of our hardware is backed by the appropriate safety certification standards. More information on safety standards.
Related Components and Products
Data acquisition and analysis re-imagined. Make unique discoveries with unlimited freedom and flexibility.
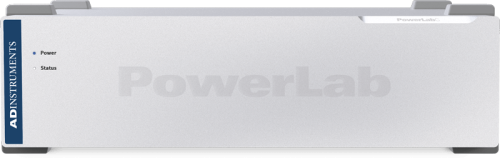
Engineered for precise, consistent, reliable data acquisition of a wide range of physiological signals. PowerLab gives you the reproducible data you need while meeting the strictest international standards.
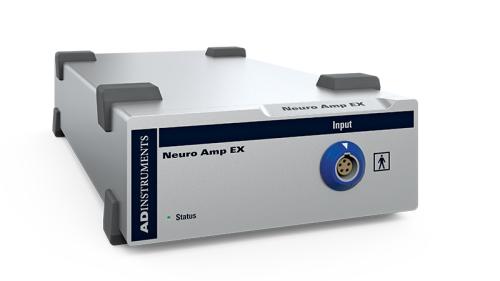
The Neuro Amp EX is a front-end device that extends the capabilities of our PowerLab data acquisition system options to record nerve activity using the microneurographic technique.
As a low noise and high gain device, it is ideal for all recording environments requiring a wide bandwidth (100 Hz to 5 kHz) and a high signal to noise ratio.
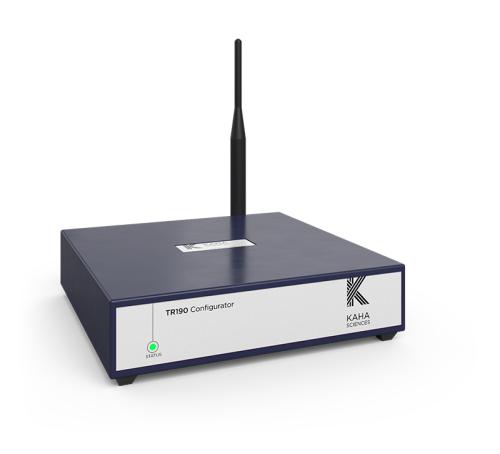
The Configurator System combines both the configurator hardware and ConfigSoft software to allow the wireless configuration and pairing of Kaha rat telemeters and their SmartPads and Kaha mouse telemeters and their tBases.
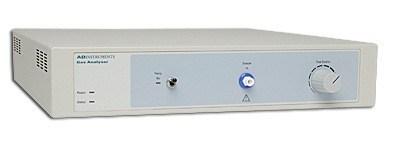
The Gas Analyzer allows the continuous measurement of respiratory gas concentrations from rats through to humans. It houses an infrared carbon dioxide sensor and optical oxygen detector. The CO2/O2 respiratory gas analyzer samples expired gas from a mixing chamber with a damped, micro-vacuum sampling pump. A flow control knob on the front of the unit provides sampling rates of 35 to 200 ml/min, although maximum flow values may vary for different sizes and lengths of tubing.
Included with the Gas Analyzer:
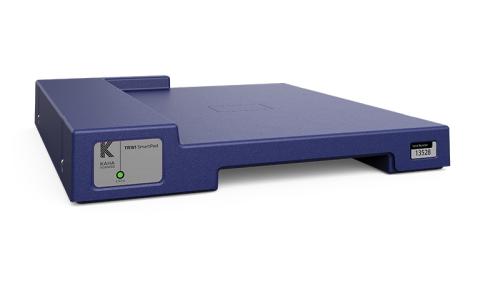
The SmartPad is a receiver and charger in a single unit and will power and receive signals from any Kaha rat telemeter.
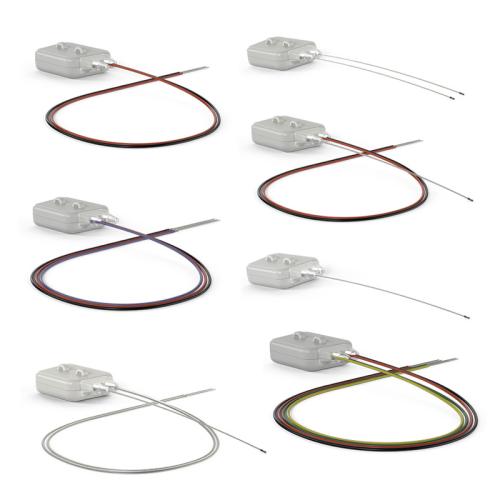
Kaha Sciences rat telemeters provide the ideal solution for research scientists looking to record high quality wireless telemetry signals.
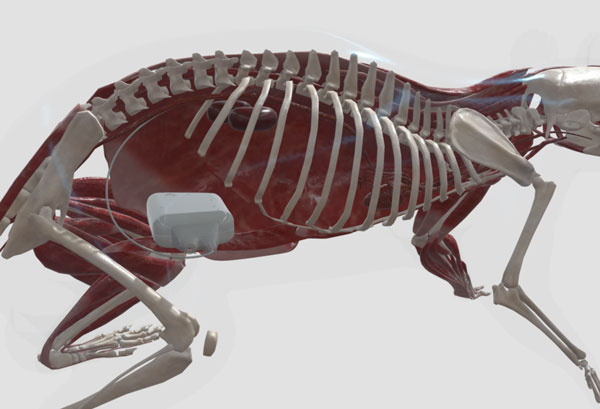
3D Implant Models
Interact with common implantation options
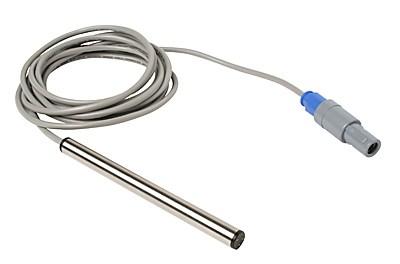
This is a high impedance headstage that can be taped directly to the skin of a human subject.

Lab Builder – Find the right products for your research.
1Select your research area
2Use smart guide to tell us your needs
3Get instant product recommendations
Flexible Data Acquisition
ADInstruments systems provide an integrated solution to advance life science research. With the combination of LabChart or LabChart Lightning analysis software and a PowerLab data acquisition unit, you have the flexibility to collect and synchronize a wide range of signals for analysis. We also offer a range of LabChart compatible solutions able to stream directly in LabChart.
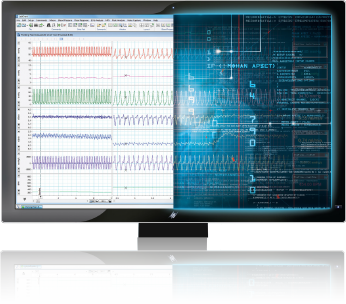
LabChart data analysis software creates a platform for all of your recording devices to work together, allowing you to acquire biological signals from multiple sources simultaneously and apply advanced calculations and plots as your experiment unfolds.
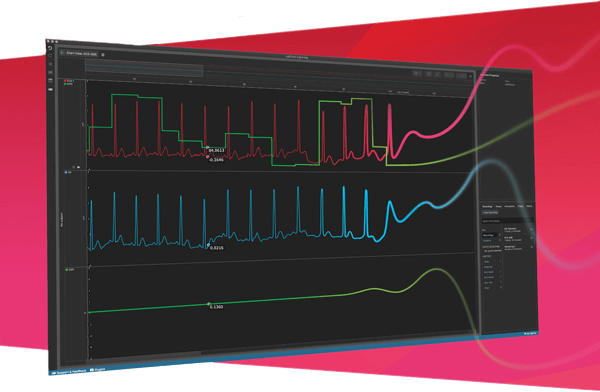
Data acquisition and analysis re-imagined. Make unique discoveries with unlimited freedom and flexibility.
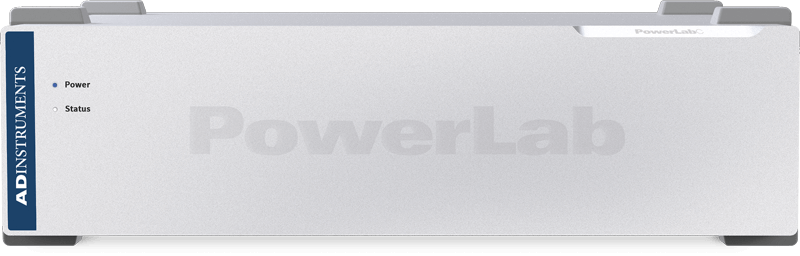
High-performance data acquisition hardware designed for life science research. PowerLab is engineered for precise, consistent, reliable data acquisition, giving you the reproducible data you need while meeting the strictest international safety standards.
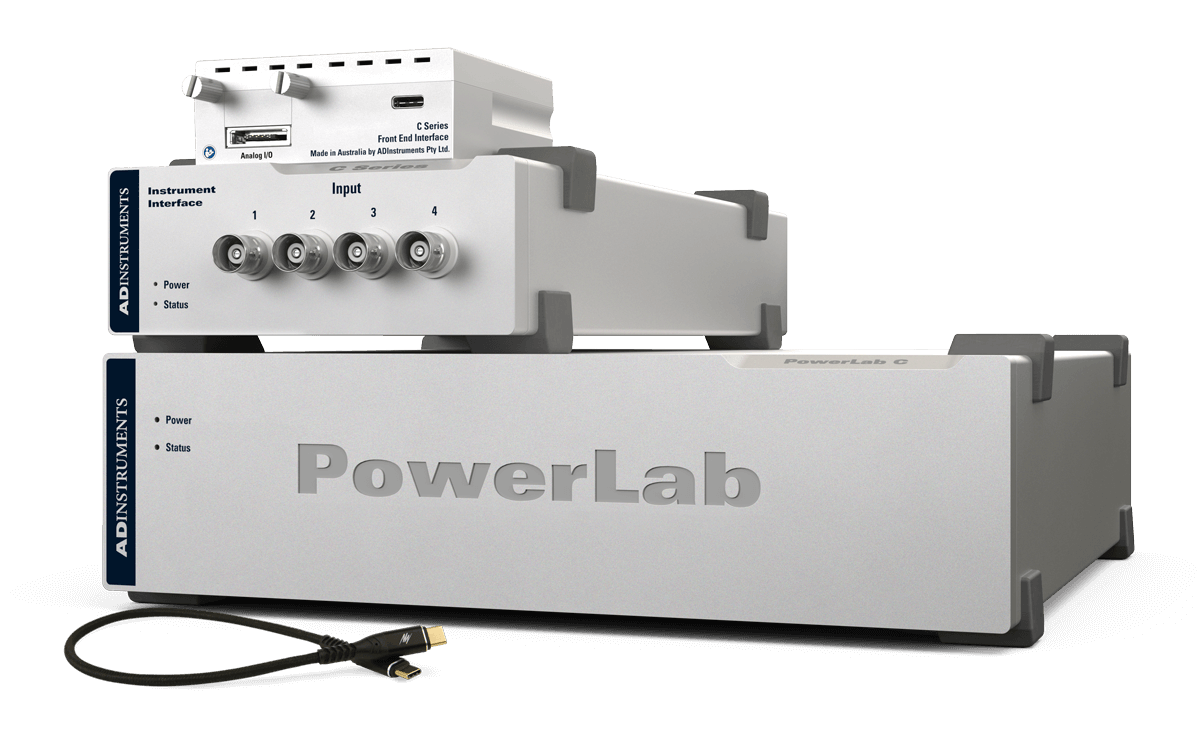
A modular data acquisition foundation system that provides unparalleled flexibility for researchers looking to invest in customizable, reliable solutions for both now, and in the future.
All your analysis in one place
LabChart software is designed specifically for life science data and provides up to 32 channels for data display and analysis options that are powerful and easy to use. With auto-recognition of ADI and LabChart Compatible hardware, multi-window views, one touch recording, simultaneous recording from multiple devices, specialized preconfigured settings, easy sharing options and an interface that can be customized to show only the features you want to use.
Features and Add-Ons
Additional acquisition and analysis options to support your Nerve Recording analysis:

Data acquisition and analysis re-imagined.
Make unique discoveries with unlimited freedom and flexibility.