This week, the Science Museum in London will launch an interactive exhibition in collaboration with the London Mathematical Society and London theatre group, non zero one. Celebrating the Mathematical Society’s 150th anniversary, ‘What’s your angle? Uncovering maths!’ is a five day festival that aims to “challenge the common perception of mathematics as difficult and esoteric, and to show visitors how contemporary mathematics transforms people’s lives and affects everyone.”
When it comes to ‘transforming people’s lives’, it’s hard to imagine a better fit than recent work by cardiovascular pharmacologist Dr Manasi Nandi and mathematician Dr Philip Aston, who will be co-presenting an exhibit at the festival entitled Cardiomorph. They head up a team of biologists and mathematicians who have collaborated to apply non-linear mathematics to blood pressure data in a completely novel way - with some surprising and potentially life-saving results.
We spoke to Manasi and Philip about their work and how it could provide the means for effective and objective diagnosis of one of the lead causes of death in intensive care units (ICU) around the world.

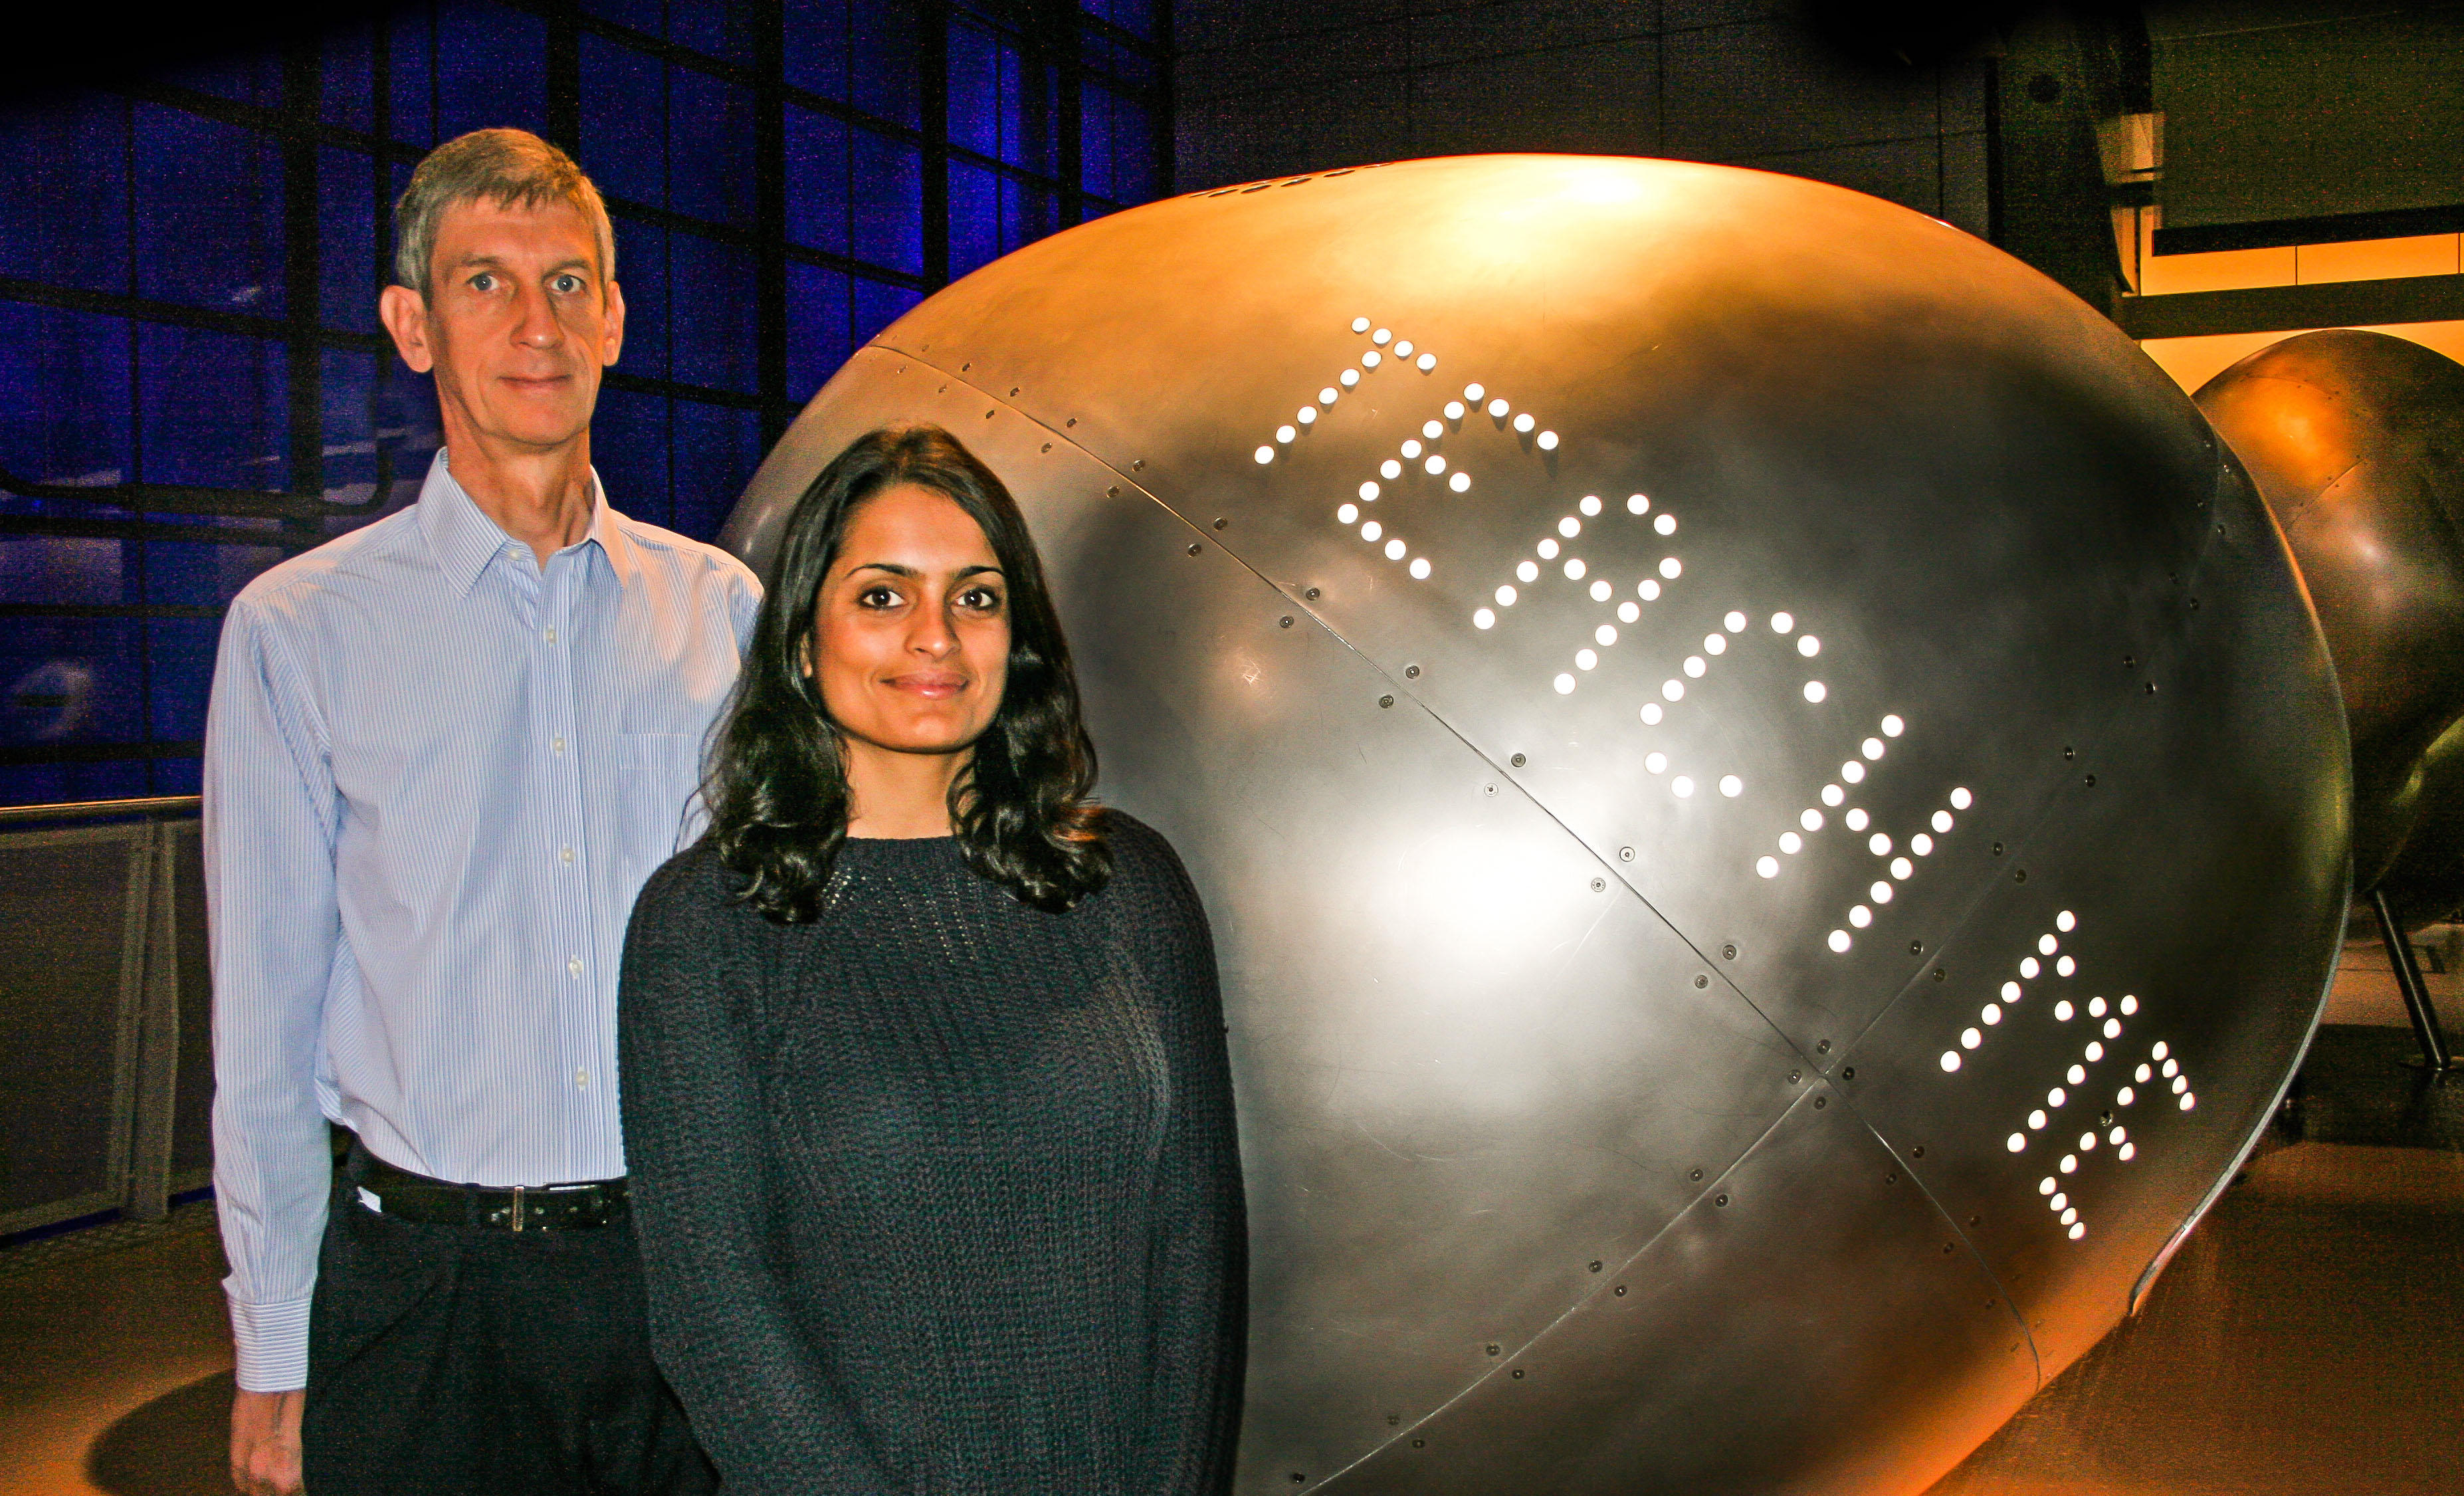
Mathematician Dr Philip Aston and cardiovascular pharmacologist Dr Manasi Nandi will co-present an exhibit at the Science Museum.
A new perspective on blood pressure
Based in the Faculty of Life Sciences and Medicine at King’s College London, Manasi’s research is focused on cardiovascular dysfunction in sepsis - a huge problem in hospitals which occurs when bacteria from an infection get into the bloodstream and, instead of a local immune reaction, they activate an all-out central response, triggering inflammatory cascades throughout the body. This can quickly escalate to septic shock where the blood pressure plummets, impairing oxygen delivery to major organs leading to multiple organ failure. It’s a serious clinical problem and a major cause of death in ICU, worldwide.
One indicator commonly used for diagnosis is a drop in blood pressure caused by leaky and dilated blood vessels - however, this is often detected too late for clinicians to make a difference. Part of the problem is that the human body has evolved to divert blood pressure from certain body systems, such as the gut and skin, in order to maintain blood pressure to vital organs such as the heart and brain when the body goes into ‘shock’. This can mean that the measured blood pressure can appear normal even though systems have started to close down in the body and the patient is actually getting ill.
The opportunity to present the problem to mathematicians came at a Mathematics in Medicine Study Group designed to promote interdisciplinary collaborations. “We normally record blood pressure data using radiotelemetry or PowerLab systems - typically 1000Hz (1000 data points a second) - but we tend to throw most of that away as it’s too much to handle using conventional analysis," Manasi explains. "Taking averages of the systolic and diastolic pressures and heart rate is useful, but by doing this we are ignoring the rest of the data contained within the waveform shape. The Study Group (organised by NC3Rs) provided an opportunity to give the raw data to mathematicians to see what they could do with it."
As a lecturer and researcher in Mathematics at the University of Surrey who was already interested in mathematical biology, Philip Aston attended the workshop in 2013. He even makes his role sound easy. "I was interested in the blood pressure data that Manasi had collected and suggested a new way of analysing the data. By the end of the week, the basic framework for analysing this data had been established." But Manasi puts it into perspective. "He did something with the data that hasn’t been done before. For mathematicians and engineers, perhaps this method is obvious but it hadn't been used in this particular way with this type of physiological signal.”
Going deeper into the Maths
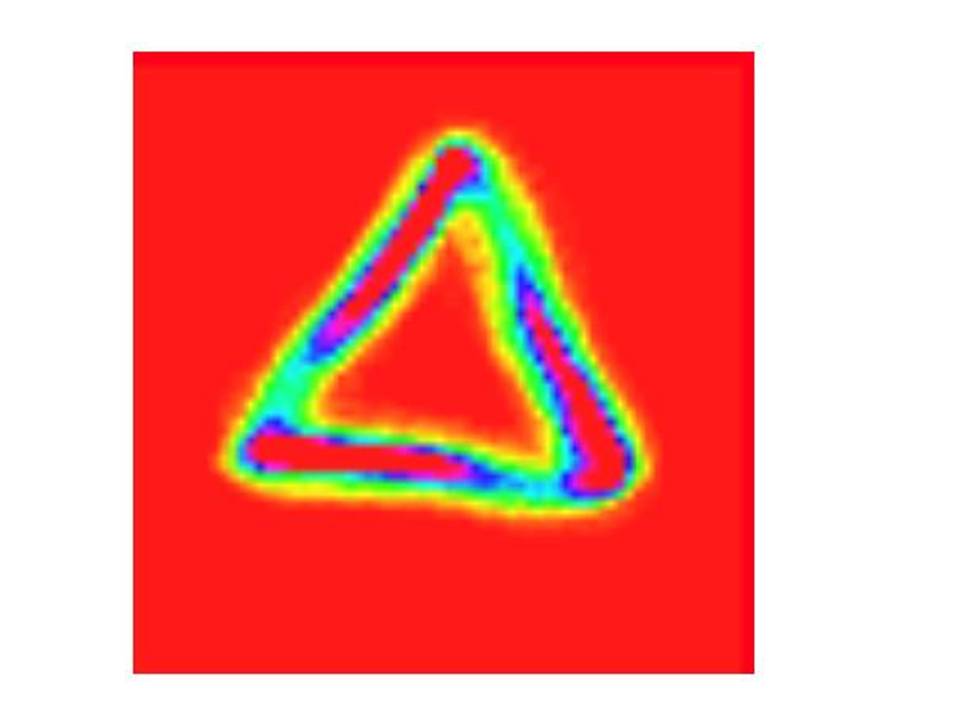
Traditionally, people have focused on systolic and diastolic blood pressure as a measure of cardiovascular health. Instead of just looking at the highest and lowest points on the waveform, Philip used all of the blood pressure waveform data, taking three equidistant points along the wave and plotting them against each other in three dimensional space. Plotting the points as they move along the wave creates an ‘Attractor’, which builds up a layer for every heart beat cycle, generating a three dimensional mesh of all the raw data points in a cube. The cube is then rotated and viewed from one corner giving a two-dimensional triangular shape. The team realised it was a way of continuously quantifying the waveform shape in real time and a potentially new way of assessing patient health.
The figure below shows such an attractor – the size and thickness of the arms, position of hot spots and angle of tilt etc. all relate to the shape of the input wave. Things that subtly alter the shape of the input wave are the nature of cardiac contraction and the state of the vascular network. The team have shown they can see changes in the attractor in the earliest stages of disease (using rodent models), before they are detectable by conventional analysis of systolic/diastolic blood pressure.

The attractor can provide insights into cardiac contraction.
The implication for ICU clinicians, is that the attractor may give information before the traditional, tell-tale signs of disease are detected by standard ICU monitors, buying precious time to run blood samples and start treatment earlier. For certain patients, this could literally be the difference between life and death.
A future in personalised medicine?
Applying insights from the attractor to the diagnosis of sepsis is just the beginning. The variations between apparently healthy people are also fascinating and seemingly endless, allowing an individual to see how they change as they age, exercise and respond to the environment around them. The team believe this method could also play an important role in developing personalised medicine - a new way of knowing an individual’s ‘personal’ cardiovascular and heart beat cycle and tracking their individual trajectory during disease, instead of basing treatment regimens on the middle of a bell curve of millions.
Are they surprised to get such a powerful outcome? Manasi: “Yes, and if you’d told me two years ago that I would be explaining my work in terms of nonlinear chaos maths I’d never have believed you! For me, what I appreciate and what is so beautiful about the maths, is that this method massively reduces bias and pulls out things you couldn’t previously detect, because you use all of the data. By combining our disciplines, we’ve found something really powerful that we never expected." Philip agrees, "It would be fantastic if this project made a difference to people’s lives. If analysing data could save lives, it would be more than worth all the time and effort that the whole team has put into this project."
 If you want the chance to see your personal attractor, don’t miss the Cardiomorph exhibition, part of ‘What’s your angle? Uncovering maths!’ at the Science Museum, London, which starts Wednesday 25th November and runs through till Sunday. See some events here for both children and adults. Or you can read more about the research behind the exhibition here.
The team: Philip Aston & Mark Christie (University of Surrey) and Manasi Nandi (King’s College London).
Contact: cardiomorph@gmail.com

