Thanks for your interest in the Cold Pressor Test protocol! Find the full protocol below. We hope it helps you in your teaching.
Teach your students a lesson they'll never forget with the cold pressor test! Use this free protocol to have your students activate their sympathetic nervous system and investigate the effect of cold water on blood pressure, heart rate, and pulse amplitude.
Experimental Protocol
Students engage in hands-on learning by applying a sphygmomanometer and listening for Korotkoff sounds using a stethoscope. They determine systolic and diastolic blood pressure and calculate mean arterial blood pressure, before asking the volunteer to submerge their hand in ice water and observing the resulting effects on blood pressure, heart rate, and pulse amplitude.
Here are the steps for setting up and running this classic experiment...
Using Lt Sensors

Related: Teach them a lesson they'll never forget! The Diving Response experiment...
Step 1: Identify learning objectives
By the end of the activity students should be able to:
- Collect, analyze, and draw conclusions from blood pressure and finger pulse data.
- Explain the physiological process that occurs during the cold pressor test, including the role of the sympathetic nervous system.
Step 2: Set up your equipment to record signals
Hardware used:

Blood Pressure Sensor
The sphygmomanometer unit is coupled to a pressure transducer that converts the air pressure in the tube into an electrical signal. The pressure also displays on the dial of the sphygmomanometer.

Finger Pulse Sensor
The Finger Pulse Sensor uses a piezo-electric element to convert force applied to the active surface of the transducer into an electrical analog signal.
Software used:
Lt
Lt is the only cloud-based learning solution that lets your students collect authentic data in the lab, with ready-to-use content for life sciences, chemistry, nursing, and medicine.
Blood Pressure and Finger Pulse set up
- Connect the following sensors to USB ports on the computer:
- Ensure the blood pressure sensor is attached to the cuff.
- Place the blood pressure cuff around the upper portion of the arm, between the elbow and the shoulder. Arrows on the pressure cuff indicate the correct cuff alignment for each arm. To align the cuff correctly the arrow should be placed over the brachial artery. The brachial artery lies medial to the biceps tendon, and just above the elbow crease. If the cuff is too big or too small, you may need to change to a different sized cuff.
- Place the pressure pad of the finger pulse sensor against the distal segment (the tip) of the middle finger of the volunteer's hand, on the same arm as the blood pressure cuff.
- Use the Velcro strap to attach it firmly, neither too loose nor too tight.

Both sensors are very sensitive to movement. It's important that both arms and the whole upper body are still during the experiment, so the volunteer must sit in a position that is comfortable and relaxed.
Step 3: Auscultation
In this part of the activity, students measure blood pressure and listen for Korotkoff sounds using a stethoscope.
SAFETY
Don't leave the cuff inflated at high pressures for too long, for the following reasons:
- Pressures greater than the volunteer's systolic pressure will prevent blood flowing into the arm.
- Pressures between the volunteer's systolic and diastolic pressure will hinder the return of the venous blood to the heart.
Always deflate the cuff completely after you have determined the volunteer's diastolic pressure.
Procedure
You will now record the systolic and diastolic blood pressure as you listen to the Korotkoff sounds. To perform this correctly, you must be familiar with the use of a stethoscope and sphygmomanometer.
- Have the volunteer sit quietly and rest for 5 minutes before measuring. This will allow their blood pressure to stabilize.
- Feel for the brachial pulse to locate the brachial artery.
- Place the stethoscope diaphragm over the brachial artery. Tighten the valve on the bulb and inflate the cuff to 160-180 mm Hg.
- Gently loosen the valve on the bulb and slowly reduce the pressure in the cuff (~1–2 mm Hg/s) while listening through the stethoscope for Korotkoff sounds.
- The systolic pressure is the pressure at which sharp, tapping sounds are first heard.
- Continue to slowly reduce the cuff pressure. The sounds will muffle before disappearing. The diastolic pressure is defined as the pressure at which the sounds disappear.
- Completely deflate the cuff after diastolic pressure is determined. Never leave the cuff inflated or partially inflated once you have finished the procedure.
- For each volunteer, record two measurements of the blood pressure. Allow 1–2 minutes between measurements for recovery.
Calculate mean arterial blood pressure
You will inflate the cuff to the volunteer's mean arterial pressure (MAP) in order to continuously monitor their blood pressure throughout the test. The MAP is a pressure between systolic and diastolic.

Diagram illustrating MAP relative to systolic and diastolic blood pressure.
It can be calculated by the following formula:

The equation for calculating mean arterial blood pressure. MAP = mean arterial pressure, DBP = diastolic blood pressure, and SBP = systolic blood pressure.
Students will record the volunteer's systolic pressure, diastolic pressure, and MAP in a table in Lt. For example:
| Volunteer | Systolic blood pressure (mm Hg) | Diastolic blood pressure (mm Hg) | MAP |
|---|---|---|---|
Step 4: Perform the cold pressor test
The question here is: "How does the cold pressor test affect blood pressure, heart rate, and pulse amplitude?"
SAFETY
Don't leave the cuff inflated at high pressures for too long, for the following reasons:
Pressures greater than the volunteer's systolic pressure will prevent blood flowing into the arm.
Pressures between the volunteer's systolic and diastolic pressure will hinder the return of the venous blood to the heart.
Always deflate the cuff completely after you have determined the volunteer's diastolic pressure.
Ice water will not damage your hand but it is uncomfortable and can be painful. You will have your hand immersed for one minute, but feel free to remove it sooner if it is too uncomfortable. If you do remove your hand early, make sure to still complete the one-minute recovery period. Your data will still be useful for the experiment.
Make sure you record approximately 10 seconds of clean, artifact-free data at the end of each of the resting, immersion, and recovery stages. This will enable you to extract accurate numbers from the data during your analysis.
Procedure
- The volunteer should relax with the sensor arm hanging loosely by their side and sit as still as possible to minimize movement artifacts.
- Select Start to record. Enter the volunteer's name into the Comment panel, then select Add. The recorded finger pulse should look similar to this example.
- Use the auto scale and compression buttons to zoom in or out on your data.
- Inflate the cuff to 5 mm Hg higher than the volunteer's MAP. This will allow for the cuff pressure to drop slightly and stabilize at the volunteer's MAP. Ensure the valve is closed tightly to prevent air leaks.
- Wait 30 seconds to allow the cuff pressure to stabilise.
- Enter "resting" into the Comment panel, then select Add.
- Prepare the comment "submersion" in the comment panel but don't add it yet. Record for approximately 1 minute. You may need to record slightly longer than this to make sure you have about 10 seconds of artifact-free data at the end of the minute.
- After a 1-minute resting period, ask the volunteer to lower their hand into the ice water, and select Add in the comment panel.
- Prepare the comment "recovery" in the comment panel, but don't add it yet.
- After a 1-minute ice water period, ask the volunteer to remove their hand from the ice water, and select Add in the comment panel.
- Record for a further 1 minute.
- Deflate the cuff completely and select Stop.
- If you would like to complete the activities with another volunteer, go back to the Auscultation step and repeat the auscultation activities.
You will record four channels of data in Lt, which will look like this:

Example data in the Cold Pressor Test Mini Lab in Lt.
Step 5: Analysis
- Scroll to the comment "resting".
- Use the auto scale and compression buttons to zoom in or out on your data.
- Use the region selector to select approximately 10 seconds of artifact-free data toward the end of the resting period. Try to avoid selecting any data that contains noise or movement artifacts.
- The blood pressure, heart rate, and finger pulse amplitude values will be displayed in value panels. Enter these into the table below.
| Volunteer | Resting BP (mm Hg) | Submersion BP (mm Hg) | Recovery BP (mm Hg) |
|---|---|---|---|
| 1 | 105 | ||
| Resting pulse amplitude (mV) | Submersion pulse amplitude (mV) | Recovery pulse amplitude (mV) | |
| 197 | |||
| Resting HR (BPM) | Submersion HR (BPM) | Recovery HR (BPM) | |
| 78 |
- Scroll to the comment "submersion".
- Use the region selector to select 10 seconds of artifact-free data toward the end of the ice water period.
- Enter the values from the Blood Pressure, Heart Rate, and Pulse Amplitude channels into the table.
- Scroll to the comment "recovery".
- Use the region selector to select 10 seconds of artifact-free data toward the end of the recovery period.
- Enter the values from the Blood Pressure, Heart Rate, and Pulse Amplitude channels into the table.
| Volunteer | Resting BP (mm Hg) | Submersion BP (mm Hg) | Recovery BP (mm Hg) |
|---|---|---|---|
| 1 | 105 | 108 | 104 |
| Resting pulse amplitude (mV) | Submersion pulse amplitude (mV) | Recovery pulse amplitude (mV) | |
| 197 | 128 | 203 | |
| Resting HR (BPM) | Submersion HR (BPM) | Recovery HR (BPM) | |
| 78 | 95 | 78 |
Their data can then be used to generate graphs in Lt.
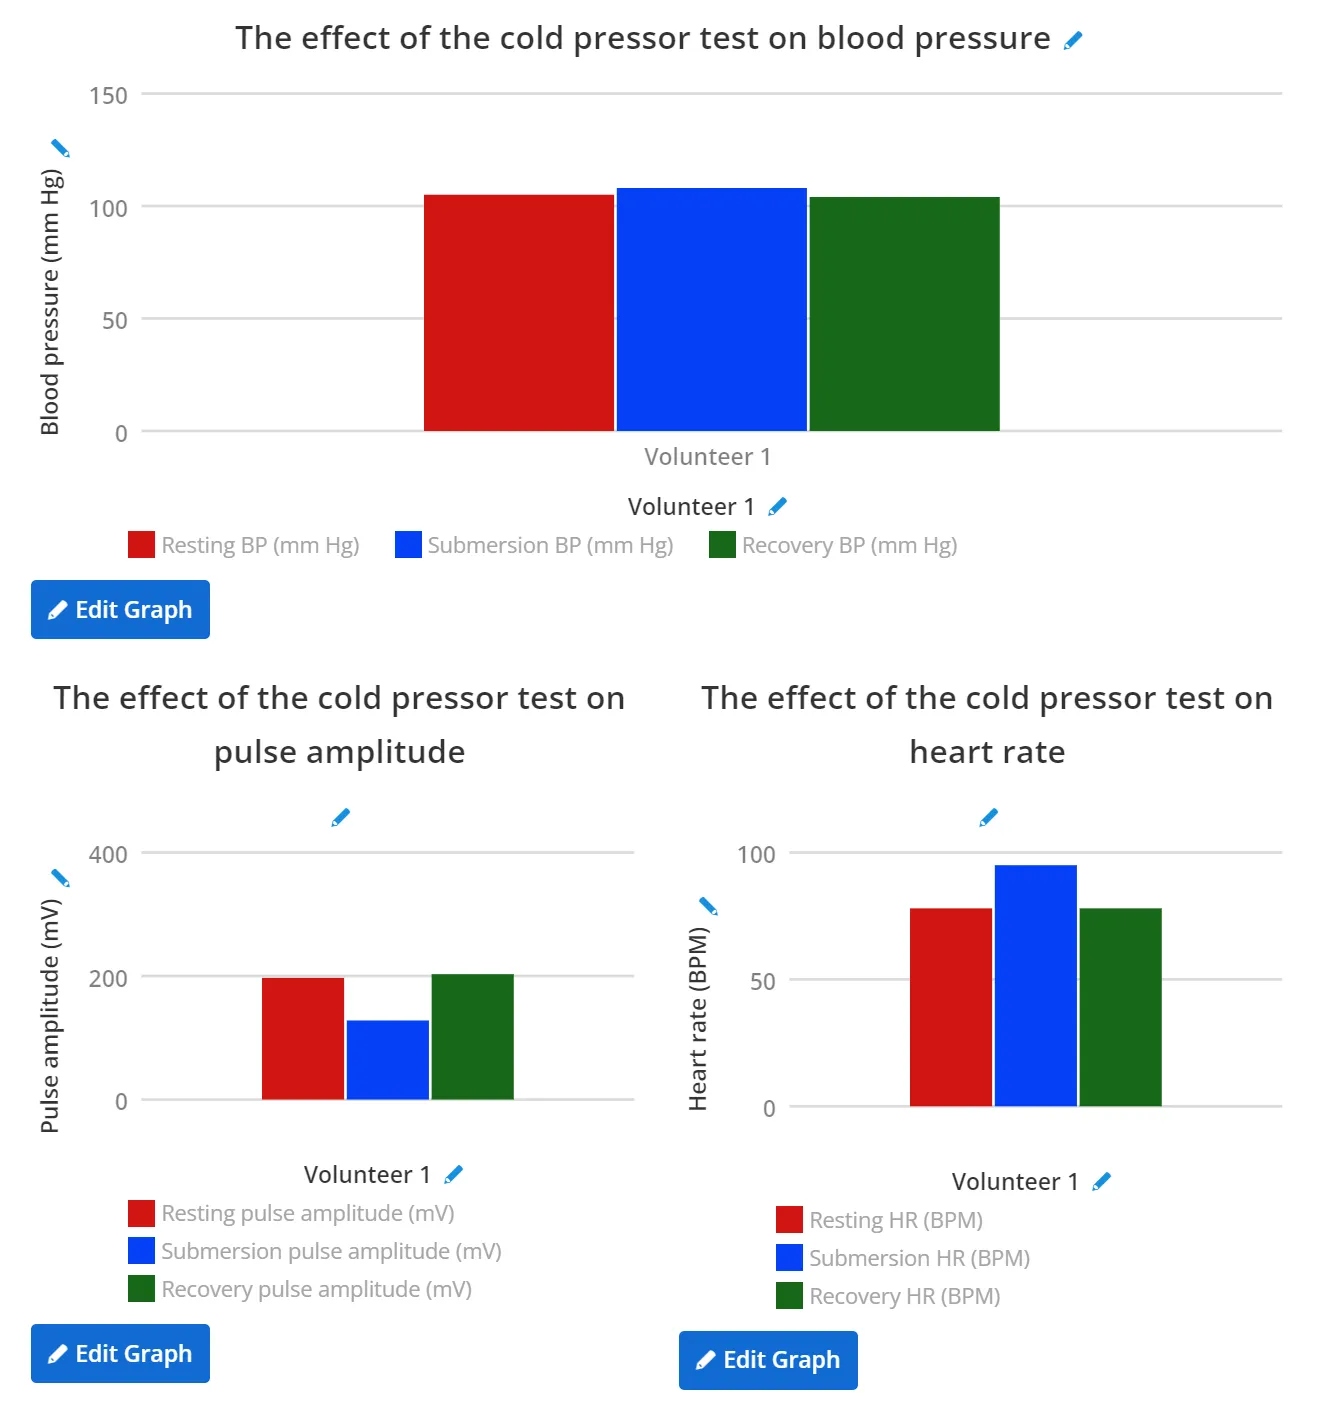
Example data summarized in graph panels in Lt.
Step 6: Check your understanding
This is a chance for students to reflect on their data recordings. Check students’ understanding by asking questions such as:
Question: What effect did the cold pressor test have on blood pressure?
Answer:
The answer depends upon the students’ own data. Generally, the cold pressor test causes an increase in blood pressure. Blood pressure quickly drops after removing the hand from the cold water.
Question: What effect did the cold pressor test have on heart rate and pulse amplitude?
Answer:
Again, the answer depends upon the students’ own data. Generally, cold water immersion increases heart rate. Pulse amplitude can be variable and may depend on how tight the sensor is on the finger as well as variations between individuals in peripheral circulation. Individuals with larger pulse amplitudes generally show a decrease in pulse amplitude during immersion before a gradual increase back to baseline during recovery.
You can find more check your understanding questions and ideas for student-led inquiry in the full lab, available in Lt.
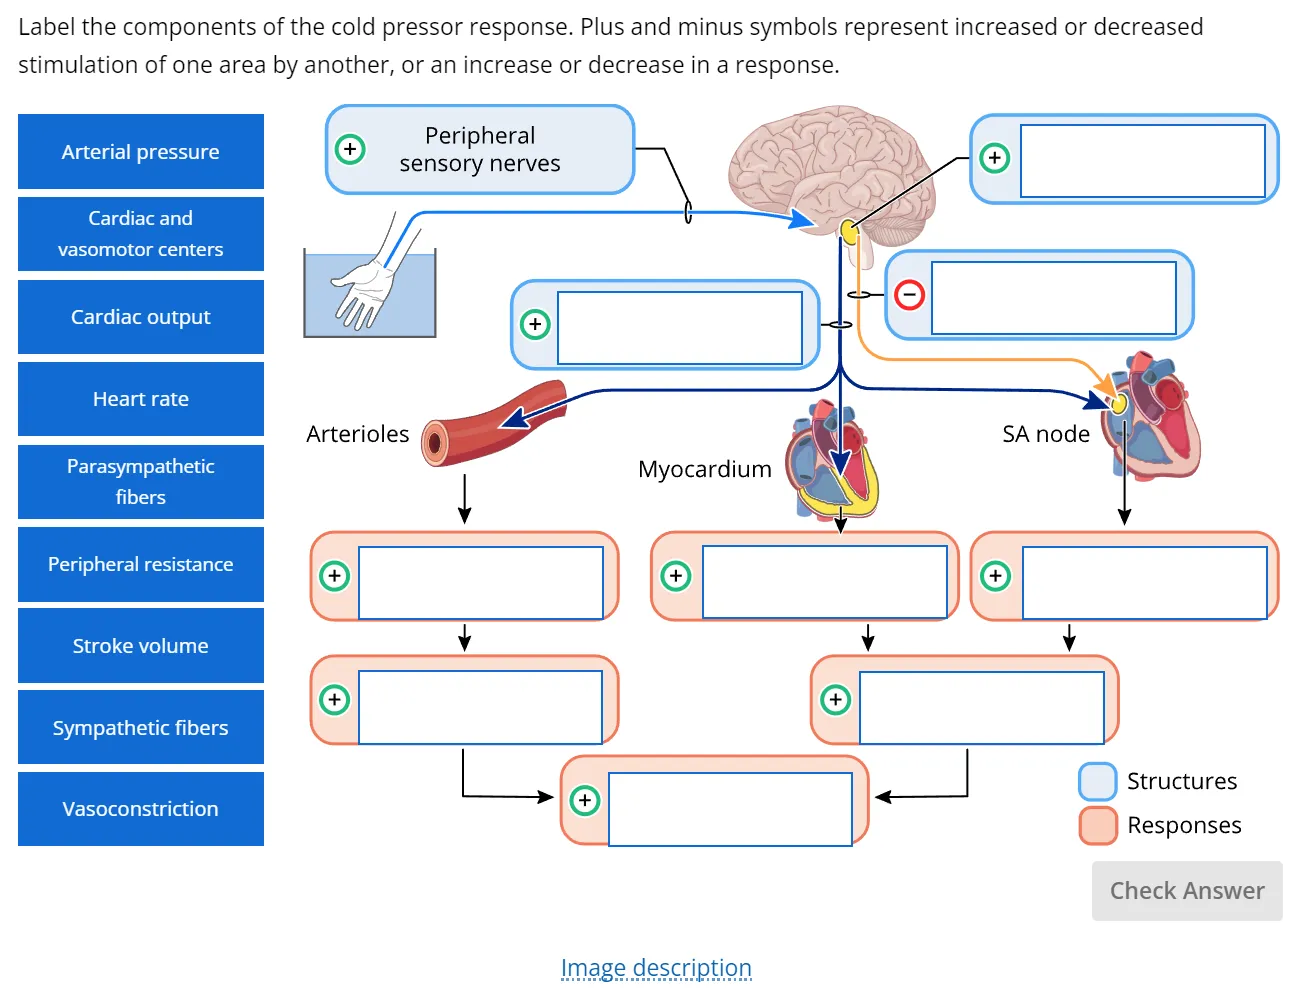
An interactive, drag-and-drop question in Lt that shows the mechanisms underlying the cold pressor test response.
Flexible Teaching
This is a short or 'Mini' lab with just two activities - a basic auscultation and the cold pressor test. We have designed it this way to allow flexible use of the lab. It could be used as a stand-alone activity, or be combined with other related labs such as the Diving Response or Autonomic Nervous System labs, found in the Lt Human Physiology Collection.