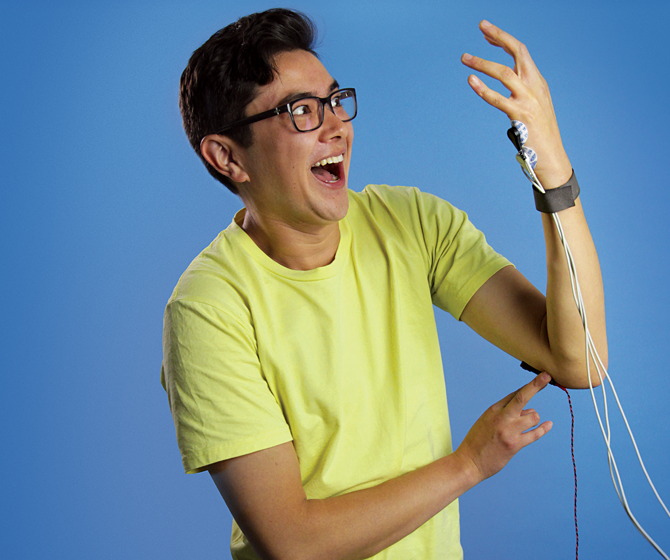
Here's how to teach your students a lesson they’ll never forget with the Grip Force Experiment - part of an interactive, immersive, and engaging lab where students examine muscular fatigue using a grip force transducer and explore muscle activity by performing electromyograms (EMGs) on themselves...
Experimental Protocol
In this lab experiment, students will perform surface electromyograms (EMGs), examine changes in electrical activity during voluntary muscle contractions, and examine some properties of muscular fatigue using a grip force transducer.
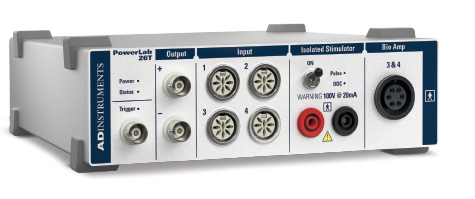
Using PowerLab 26T
Here are the steps for running this interactive and engaging lab activity:
- Step 1: Identify learning objectives
- Step 2: Set an hypothesis to test
- Step 3: Set up equipment to record an EMG
- Step 4: Perform an EMG
- Step 5: Analyze an EMG signal
- Step 6: Set up & calibrate for the Grip Force Experiment
- Step 7: Run the Grip Force Experiment:
- Run Muscle Fatigue Test
- Run Force With Encouragement Test
- Run Visual Feedback Test
- Step 8: Discuss / repose original hypothesis
Step 1: Identify learning objectives
By the end of this lab students will be able to do the following:
- Record surface EMGs.
- Measure the decline in maximal force during a sustained contraction.
- Examine some properties of muscular fatigue.
- List factors that may contribute to muscle fatigue.
Step 2: Set an hypothesis to test signals
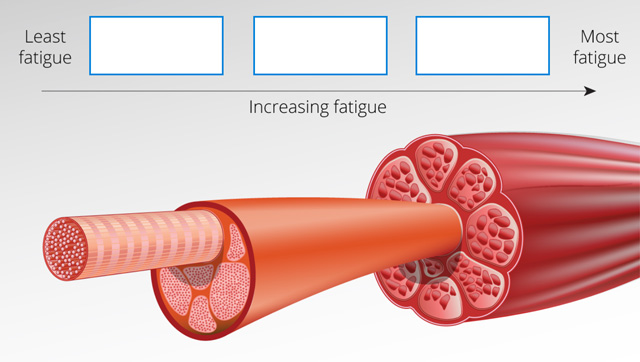
Ask students to imagine they are contracting their muscles at their maximum. Have your students rank the following three factors based on which they think will have the biggest effect on increasing muscle fatigue.
Their answer is the hypothesis that will be tested with the grip force experiment.
Step 3: Set up equipment to record an EMG
Ask for a volunteer to perform the electromyography procedure, and attach electrodes to the volunteer.
Electromyography is a technique that measures the electrical activity of muscles. The data recorded is an electromyogram; also known as an "EMG" or "myogram".
Equipment used
Data acquisition hardware used: PowerLab 26T - includes an
inbuilt biological signal amplifier
Data analysis software used: Lt: Life Science teaching software / LabChart
Additional hardware used: Grip Force Transducer, Electrodes and accessories
Setup
Before electrode attachment
- Remove any jewelry from the volunteer's wrists.
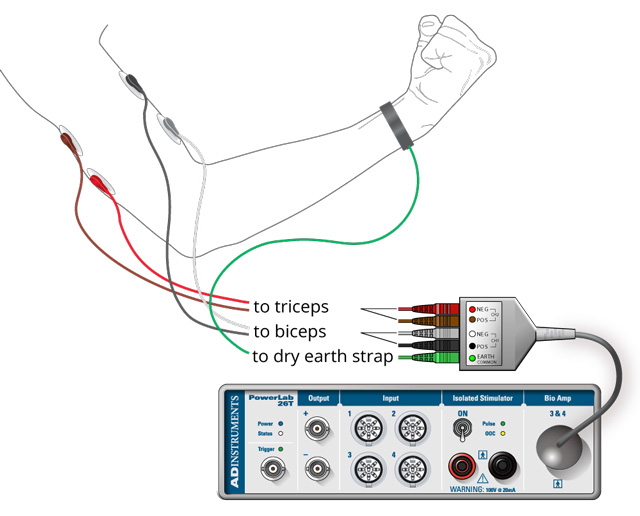
- Connect the five-lead Bio Amp cable to the Bio Amp socket on the PowerLab.
- Connect the five color-coded shielded lead wires to the Bio Amp cable.
- Make sure your data acquisition hardware (PowerLab) is connected to the computer and turned on.
- Attach the green shielded lead wire to the dry earth strap. (If the dry earth strap has a single connector lead wire, see how to connect it to the Bio Amp cable.)
- Firmly attach the dry earth strap around the volunteer's wrist. The fuzzy side of the dry earth strap needs to make full contact with the skin.
- Lightly mark two small crosses on the skin overlying the volunteer's biceps muscle, and two crosses over the triceps muscle. The crosses should be 2–5 cm apart and aligned with the long axis of the arm.
Electrode attachment
- Lightly abrade the skin over the crosses with abrasive gel, then clean with an alcohol swab.
- Snap the CH1 and CH2 shielded lead wires onto the disposable ECG electrodes.
- Place the CH1 electrodes over the crosses on the volunteer's biceps, and the CH2 electrodes over the crosses on the volunteer's triceps. Press firmly so they adhere well. It doesn't matter which is positive and which is negative.
- Check that all 4 electrodes and the dry earth strap are properly connected to the volunteer and the Bio Amp cable before proceeding.
Step 4: Perform an EMG
The question for students here is: "What does an EMG trace look like and how does it change with increasing muscle activity?"
Procedure
Part 1
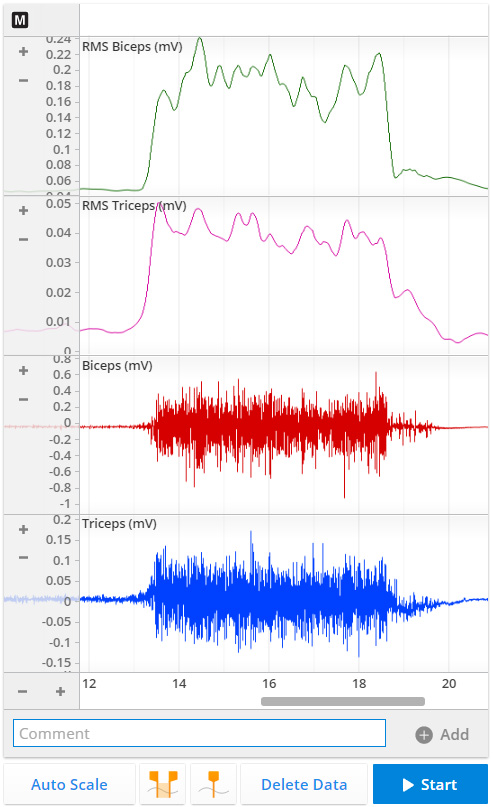
- Set up your data analysis software to record 4 signals:
- Channel 1: raw EMG signal for Triceps
- Channel 2: raw EMG signal for Biceps
- Channel 3: Root mean square (RMS* or rms) of the Triceps EMG signal
- Channel 4: Root mean square (RMS* or rms) of the Biceps EMG signal
*RMS indicates the intensity of the activity. Learn more.
- Ask the volunteer to sit in a relaxed position with an elbow bent to 90°, and the palm facing upwards. The volunteer should use his or her other hand to grasp the wrist of the arm from which the signal is being recorded.
- Start recording on your data analysis software. Label as "biceps contraction". Ask the volunteer to moderately contract the biceps muscle for 3–5 s by trying to bend the arm while resisting this movement with the hand grasping the wrist.
- Ask the volunteer to relax for a few seconds.
- On your software, add the label/comment: "triceps contraction". Ask the volunteer to moderately contract the triceps muscle for 3–5 s by trying to straighten out the arm while resisting this movement with the hand grasping the wrist.
- Ask the volunteer to relax for a few seconds.
- Repeat steps 1–5, but this time make a maximal contraction of the biceps and then the triceps muscles.
- Stop your recording.
Part 2
- Ask the volunteer to sit in a relaxed position as before, (ensure their arm is not resting on anything).
- Start recording on your data analysis software.
- Enter "no books" as a comment or label.
- After 3–5 s, add the comment: "1 book". Place a book (or a similar weight) on the volunteer's hand and ask them to remain as still as possible.
Record for 2–3 s. - Stop recording
- To record the effect of increasing weights, repeat steps 2–5 and increase the number of books by 1 each time until you reach 4 books. Add a comment/label for each book addition.
Step 5: Analyze an EMG signal
Here, students will analyze how voluntary muscle contractions change with increasing demand.
Before beginning:
Have your students scroll through the recorded data and note the relationship between the raw traces (Biceps and Triceps) and the processed traces (RMS Biceps, RMS Triceps).
The height of the RMS trace reflects the overall activity of the raw EMG signal, and gives a simpler view of the muscle's electrical activity.
Analysis
- Expand a small section of the biceps activity. (Note how the raw EMG signal is composed of many spikes; this is the electrical activity of many motor units).
- Use the region selector to highlight the section where one book was added. The maximum RMS values for both the biceps and triceps will be displayed in the value panels.
- Note these values.
- Repeat steps 2–3 for each additional book.
Some questions to test your students’ understanding:
Question: Unlike the discrete waveform from an ECG, the EMG waveform is irregular. Why is this?
Answer: An ECG records electrical activity from the heart. Unlike the heart, skeletal muscle does not contract in a fully synchronized fashion. Instead, an EMG records the unsynchronized electrical activity of many muscle fibers.
Question: How did the EMG trace change when you added weight to the volunteer's arm? Based on the data you collected, what can you infer is happening to the muscles as weight is added?
Answer: When more books were added, the recorded activity (primarily in the biceps) increased. From the recorded data, it can be inferred that greater motor unit activity is required to generate more force in order to hold the arm in the same position when more books are added.
Step 6: Set up & calibrate for the Grip Force Experiment
The question here is: "What happens when we try to sustain a maximal force?"
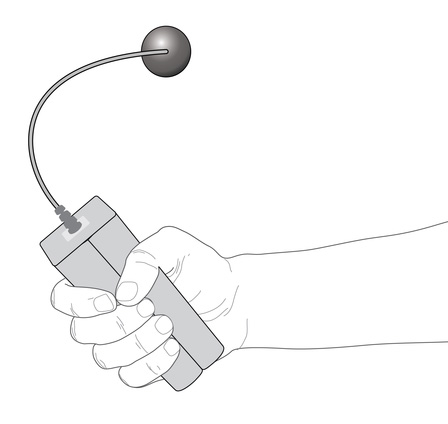
Attach grip force transducer
- Ensure your data acquisition unit or hardware (e.g. PowerLab) is connected to your computer and turned on.
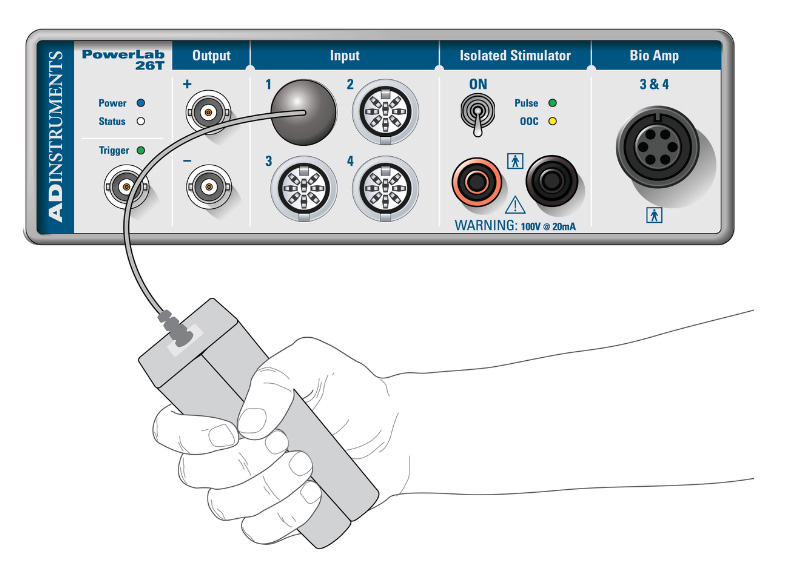
If students have been using a PowerLab for this experiment, unplug the Bio Amp cable. - Connect a grip force transducer to Input 1 of your data acquisition hardware.
Calibrate the equipment for grip force
Students will now find the volunteer's maximum grip force, and use this to calibrate their grip force from 0–100%.
Procedure
Maximum contraction
- Begin recording on the analysis software.
- Leave the grip force transducer undisturbed on the table for 5 s. This will be the baseline data for zero force.
- Next, ask the volunteer to squeeze the grip force transducer as hard as possible, for as long as possible. This will be the area of maximal grip force.
- After 5 s, tell the volunteer to relax and stop recording.
Calibration
- On your analysis software, highlight or select a region of baseline data for zero force. Type "0" as its corresponding percentage value.
- Next, select an area of maximal grip force. Select the small arrow next to Value 2 in the Units Calibration panel to enter this value. Type "100" into the corresponding percentage value.
- On your software, select “Calibrate” or similar. The Grip Force units should now change to %.
The calibration is now complete.
Step 7: Run Grip Force Experiment
Run Muscle Fatigue Test
The question here is: "How can we explain the decline in maximal force during a sustained contraction?"
This phenomenon is called "muscle fatigue".
Before you begin
Ensure the volunteer can see the computer screen where their signal will appear.
Procedure
- Begin recording. Ask the volunteer to apply and maintain 25% of their maximal grip strength while watching the recorded trace. Enter "25%" in as a comment or label on the recording.
- After 25 s, tell the volunteer to relax and stop recording.
- Wait for 30 s to allow recovery of muscle function.
- Repeat steps 1–3 for contractions of 50%, 75%, and 100% of maximal grip strength. Add a comment for each trial.
Analysis
In this analysis students will determine how fatigue affects grip force at different intensities.
- Create a table like this:

- Ask students to scroll to their 25% grip force data.
- Place a marker on the baseline just before the increase in force. Place the point selector at 1 s into the contraction. Note the change in grip force from the baseline.
- Note this value in the appropriate cell in the table (above).
- Repeat steps 2–3 for 5 s, 10 s, and 20 s into the contraction.
- Repeat steps 2–4 for 50%, 75%, and 100% grip force.
Check students’ understanding
Question: Did this experiment help you decide which of the factors proposed to explain fatigue are important?
Answer: You may have noticed that there is a greater decline in your volunteer's grip force during the more strenuous contractions (75%, 100%) compared with the less strenuous contractions (25%, 50%). This is with "visual feedback" present, where the volunteer can see the decline, and can attempt to correct for it. There is clearly more fatigue occurring during the more strenuous contractions. A decline in "central drive" will also have affected some of the results.
Run Force With Encouragement Test
The question for students here is: "Can we alter the extent of muscle fatigue by verbal encouragement, or brief rests?"
Before you begin
Ensure the volunteer cannot see the computer screen where their signal will appear.
Procedure
Encouragement
- Start recording, and ask the volunteer to produce a sustained maximal contraction (100% grip force).
- After 8–10 s or when the force has obviously declined, enter the comment/label “Encouragement” and immediately instruct the volunteer to try harder.
- After a further 8–10 s, reenter the comment “Encouragement” and then repeat the encouragement.
- Repeat step 3, so the volunteer has been encouraged a total of 3 times.
- A few seconds later, ask the volunteer to relax and stop recording.
Rest
- Start recording.
- Ask the volunteer to produce a sustained maximal contraction (100%).
- After 8–10 s enter the comment / label “Rest”, and instruct the volunteer to relax very briefly (~0.5 s) and then return to maximal contraction.
- Repeat step 3 another 2 times, so the volunteer has rested for a total of 3 times.
- After 30–40 s, stop recording.
Analysis
In this analysis students will determine the effects of encouragement and brief rest on sustained maximal grip force.
- Create a table like this:

- On the recording, have the students scroll to the comment "Encouragement".
- Note the value at the beginning of the first contraction. Note the value at the lowest point just before the first "encouragement". Calculate the change in grip force.
- Enter the value into the appropriate cell in the table.
- Repeat steps 2–3 for each trial, (using the values just after the period of encouragement, and the value just before the following period of encouragement to calculate the change in grip force).
- Repeat steps 2–4 for the periods of rest.
Check students’ understanding
Question: From your data, do you think that verbal encouragement or brief rests limited the extent of muscle fatigue?
Answer: Encouragement and brief rests have been shown to limit fatigue to some extent during sustained maximal grip force.
Question: During sustained skeletal muscle contraction, can you think of three places in which true fatigue might occur?
Answer: The main place true fatigue is likely to arise from is the skeletal muscle cell, in which:
A reduction in Ca2+ ion release (due to depletion of Ca2+ ions from intracellular stores) could potentially inhibit excitation-contraction coupling, or
Metabolic changes in the muscle cell (such as build up of lactic acid which can make the skeletal muscle acidic, inhibiting any further anaerobic glycolysis), which is more likely to occur in extreme exercise.
Actual muscle fatigue may not just arise in the skeletal muscle cell. It could also occur at the neuromuscular junction (NMJ), possibly due to depletion of acetylcholine stores or decreased sensitivity (desensitization) of ACh receptors, resulting in decreased effectiveness of neuromuscular transmission. It may also occur due to a reduction in blood flow (and hence limited O2) to the muscle owing to compression of blood vessels..
Run Visual Feedback Test
The question for students here is: "What effect does visual feedback have on the ability to maintain a grip contraction with constant force?"
Before you begin
Ensure the volunteer can see the computer screen. Allow the volunteer to use their other hand if gripping the transducer has become painful.
Procedure
- Start recording. Ask the volunteer to produce a 50% contraction while watching the trace.
- After 20 s add the comment / label “eyes closed”. Ask the volunteer to close his or her eyes and attempt to maintain exactly the same contraction force for the next 20 s.
- Write the comment / label "eyes open" and add this as you ask the volunteer to open his or her eyes and adjust the contraction force back to 50%.
- When adjusted to 50%, stop recording.
Analysis
In this analysis students will determine how visual feedback affects sustained maximal grip force.
For the analysis, create a table like this:

Visual feedback
- Have students scroll to the visual feedback data.
- Note the value near the beginning of the contraction when it has reached 50%.
Note the value directly before the "eyes closed" comment.
Calculate the change in grip force and note this value. - Enter the value into the appropriate cell in the table.
Without visual feedback
- Note the value just after the "eyes closed" comment.
Note the value just before the "eyes open" comment.
Calculate the change in grip force and note this value. - Enter the value into the appropriate cell in the table.
Check students’ understanding
Question: Examine the data recorded when the volunteer attempted to maintain a 50% contraction with their eyes shut.
Almost all volunteers will show a declining force (pseudo-fatigue) while their eyes are shut that is very similar to actual fatigue. This is not true fatigue because the full 50% force can be exerted easily, as can be seen when the volunteer's eyes are opened again. What explanations can you think of for pseudo-fatigue?
Answer: In the absence of information on the actual force produced, the internal sensation of fatigue can predominate and lead to a decline in the force generated.
Step 8: Discuss / repose original hypothesis
At the beginning of this lab, you asked students to make a hypothesis by ranking three factors based on which they thought would have the biggest effect on increasing muscle fatigue.
Discuss with students how their experience of testing each of the factors in the lab would require them to reform your hypothesis? If so how?

Dry earth strap with single connector cable
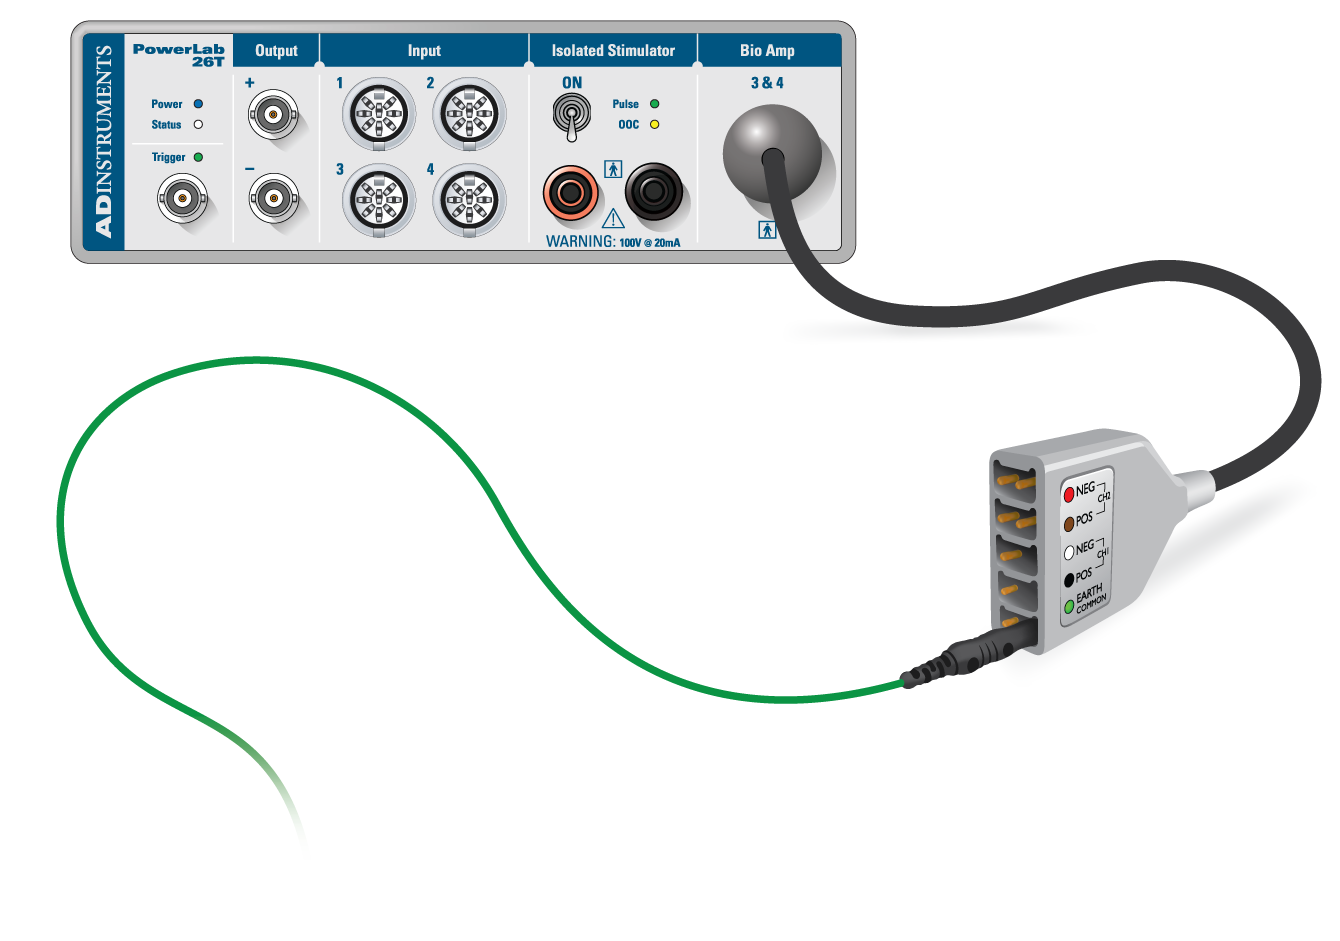
The single connector cable of the dry earth strap should be placed on the single pin nearest the EARTH label.
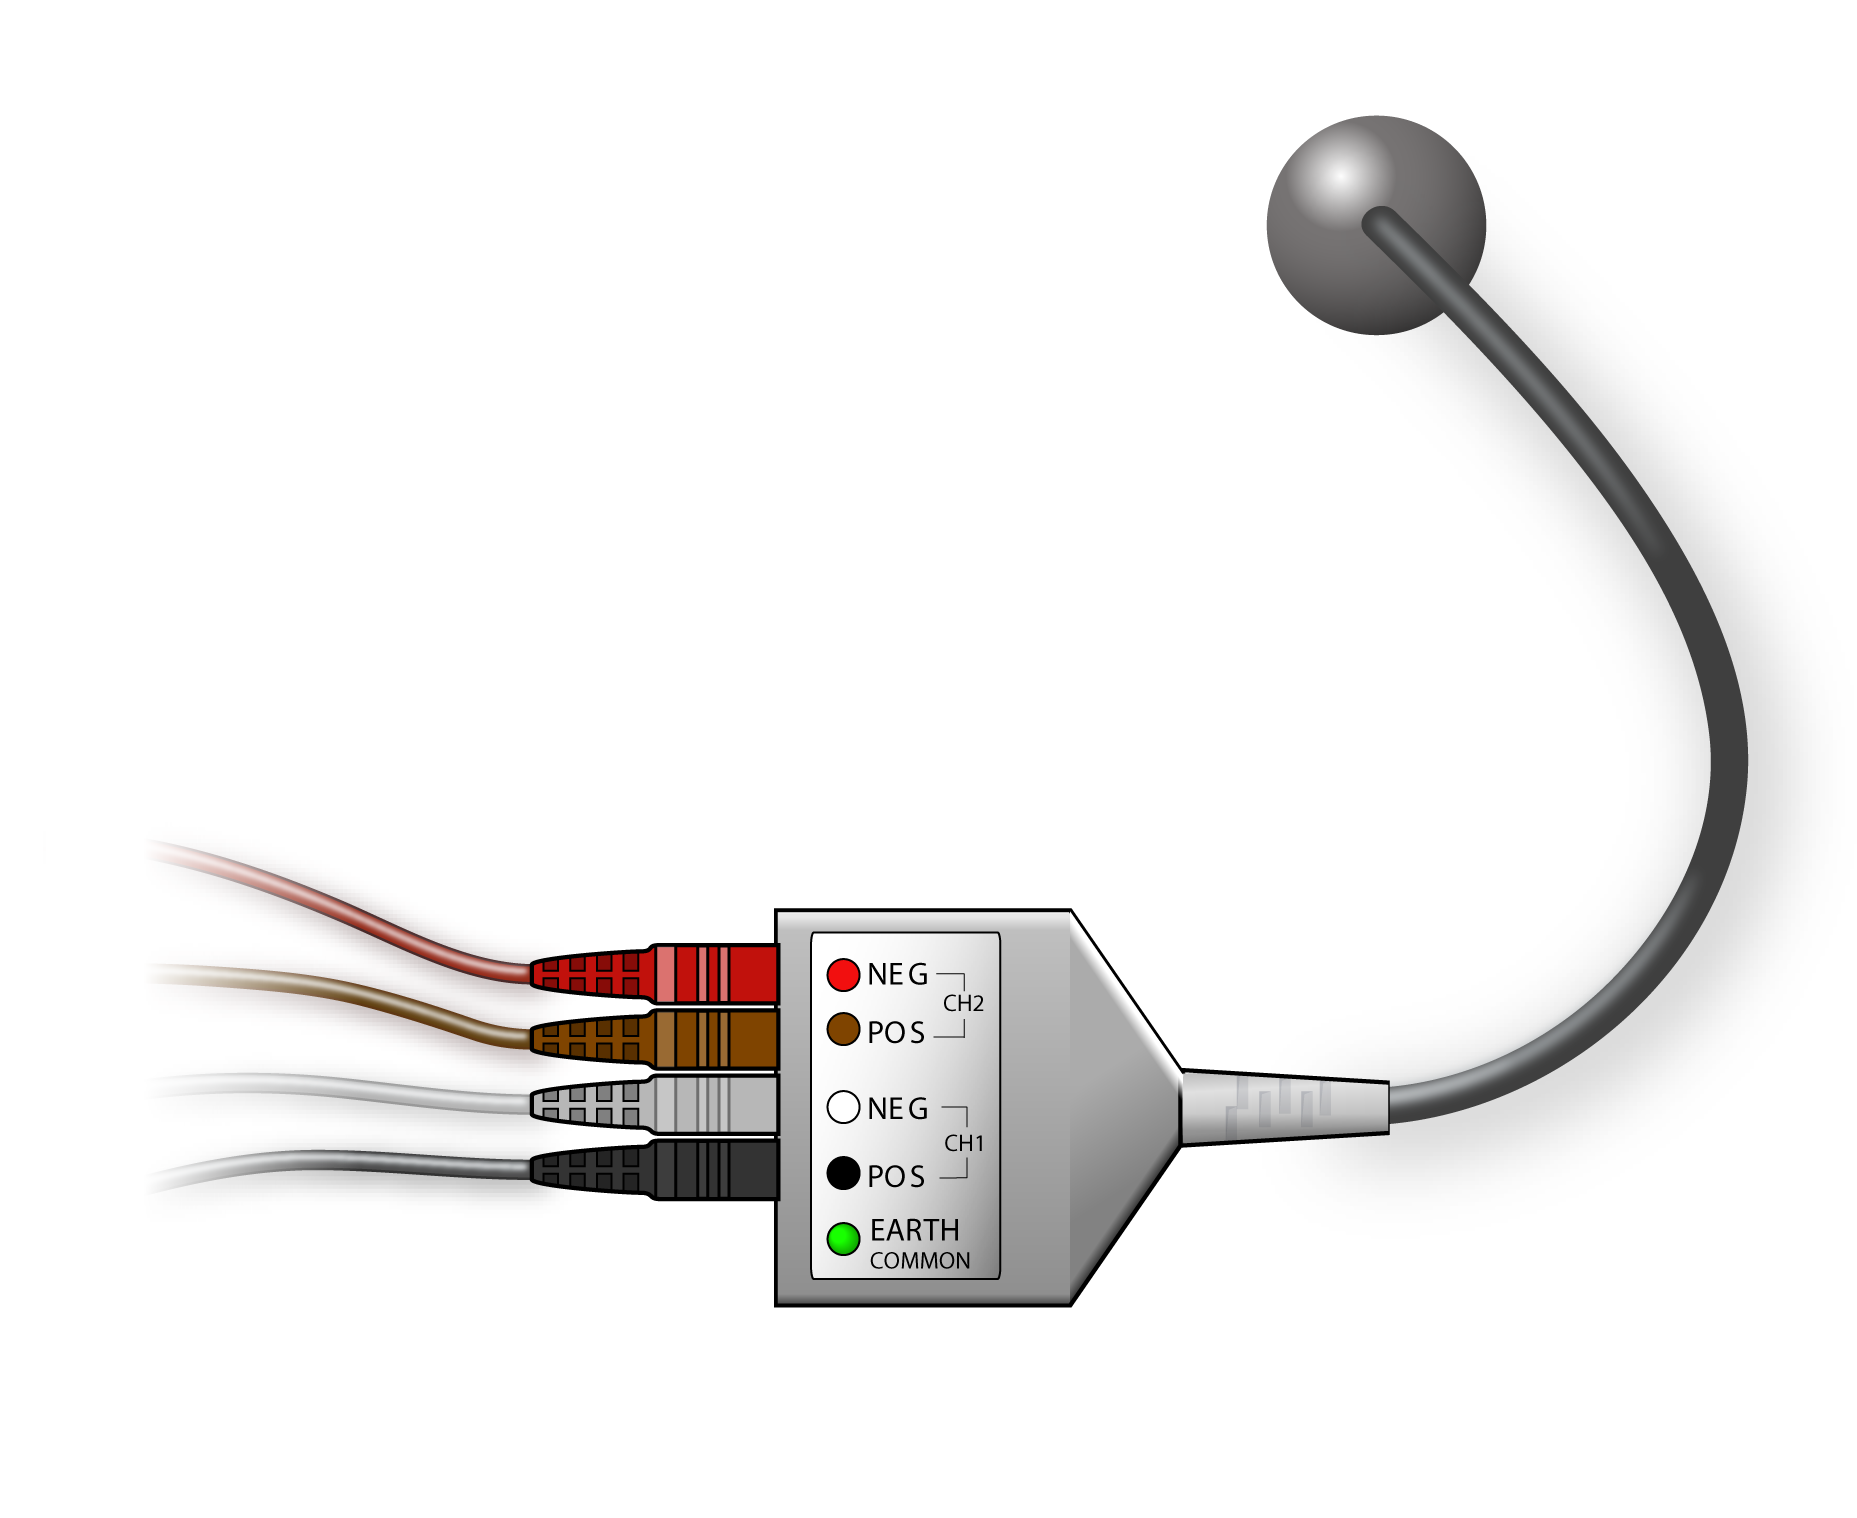
The remaining shielded cables should be connected to CH1 and CH2 of the Bio Amp cable.
How is RMS calculated:
You will have noticed that the raw EMG signal values fluctuate above and below zero. From this we cannot directly get a meaningful value of intensity. The mathematical "trick" to deal with this is to use an RMS calculation. This is how it works:
- (For each given point in time), square all the values, as the square of a negative value gives a positive value (now all your values are positive!).
- Next, sum all the squared values, and take their mean.
- Then take the square root of that mean.
The RMS gives an indication of the strength of the contraction at any given time. RMS has the same units as the raw data.

