Software Features
Lt LabStation’s cutting edge functionally allows you to fully customise features to adapt to your teaching style, saving you time in preparation – and encouraging greater engagement with your students.
PowerLab Data Acquisition
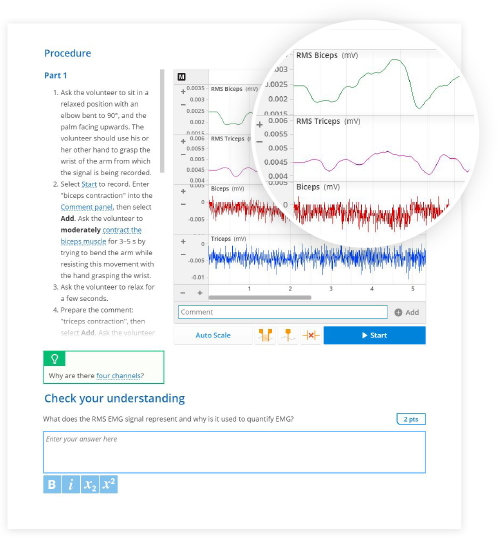
Lt LabStation allows you to add custom LabChart settings files to Data Sampling or Scope Sampling panels so that students can record live physiological data, or you can provide Read-only Data for your students to analyze. Lt LabStation has built-in presets for various applications including EMG, Blood Pressure, ECG, Spirometry flow and volume, and Pulse and heart rate.
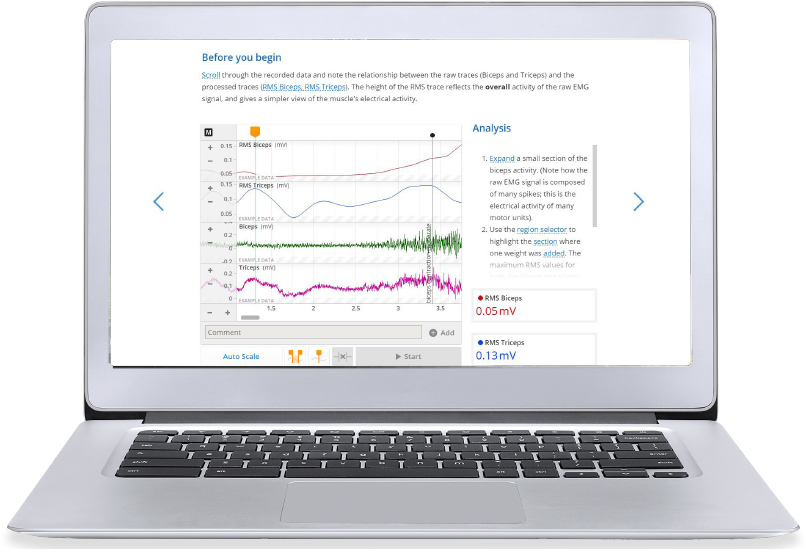
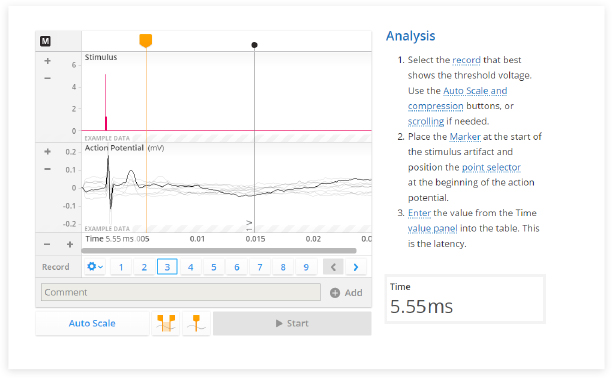
Data Analysis
Students can use the region selector, point selector, marker, and value panels to analyze their recorded data.
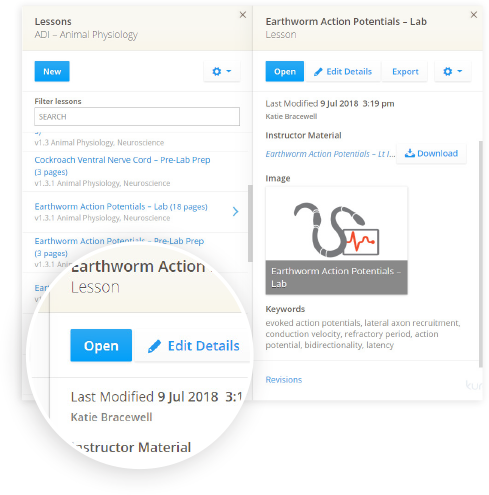
Lessons
Lt LabStation makes it easy to author beautiful and interactive lessons. Lessons can be anything from a tutorial, lecture, presentation, lab, assessment, or even an exam. Each lesson is filled with different panel types that allow you to add in information, questions, and multimedia aids to get your students engaged in the material. Lessons can be stand-alone or grouped together into modules.
Authoring
Each time a lesson is edited a revision is recorded so you can see who has worked on the lesson, view previous revisions, add comments if you’ve reached a milestone, or even restore an older version if needed.
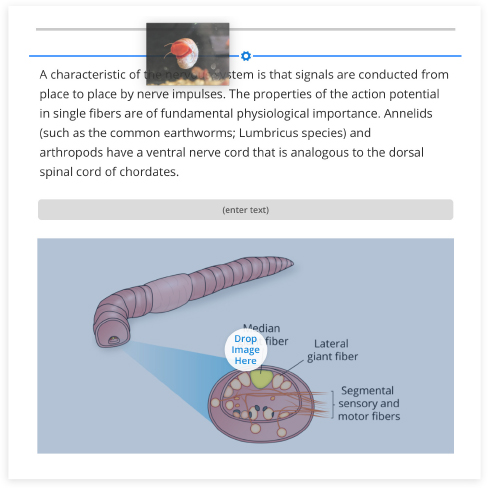
Drag and Drop content
Create lessons quickly using Lt LabStation’s drag and drop feature. You can drag text and images from existing resources and drop them in Lt LabStation to create different questions and even tables. Panels can be easily moved around so that your page always looks beautiful.
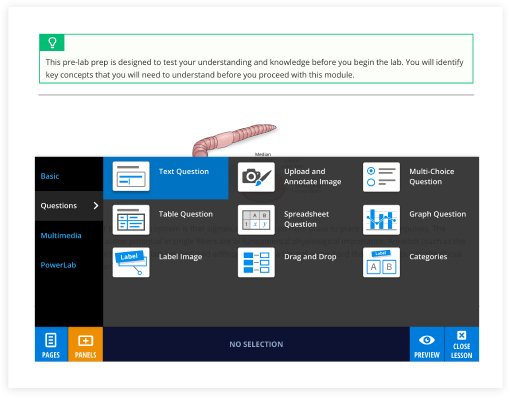
Question Panel Types
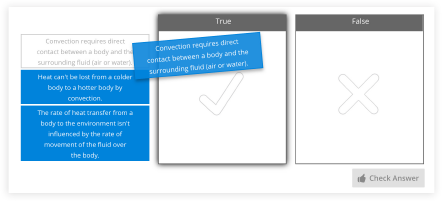
Lt LabStation has standard Text Question and Multi-Choice questions, as well as Label Image, Upload and Annotate Image, Categories, Table Questions, and Drag and Drop questions to allow you to teach the way you want to teach. Mix and match panels to make engaging, memorable lessons!
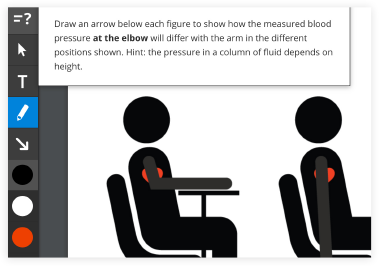
Upload and Annotate Image
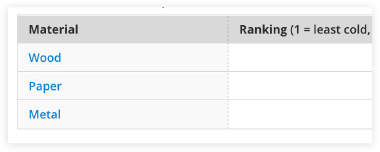
Table Questions
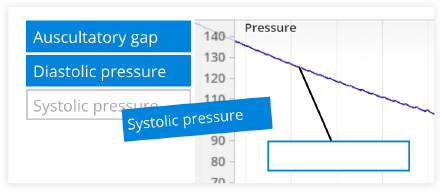
Label Image
Categories
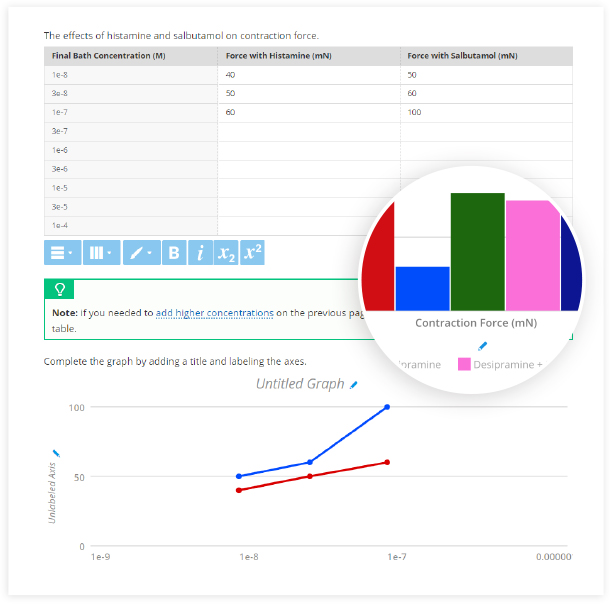
Tables and graphs
Students can enter data into tables or spreadsheets and choose how to plot this data on graphs, or you can present information yourself to create beautiful Bar, Line, or Scatter Graphs.
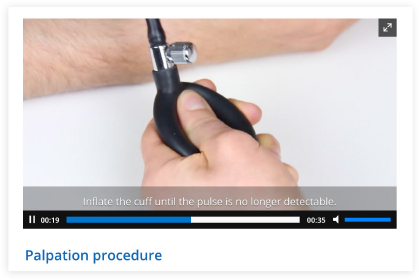
Multimedia Panels
Video and Audio files can be added to make your lessons richer. Add images and closed caption files to your videos too.
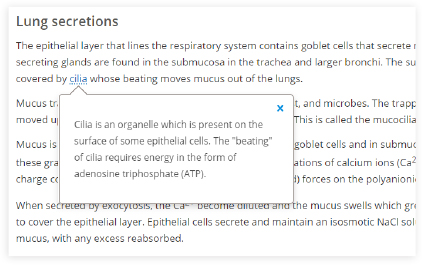
Layers of Content
Lt LabStation allows you to add extra information for those students who need it via the Background page, or you can add more information to selected text using popups.
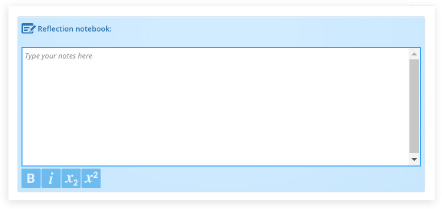
Notebook
You can add notebook panels for students to record notes throughout the lesson.
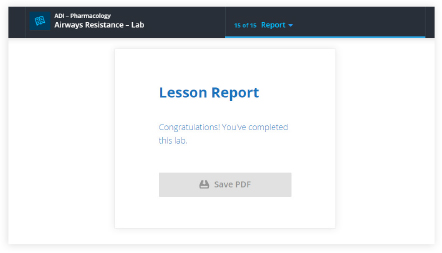
Report Page
Completion pages can be added to the end of lessons if you want your students to Complete or Commit their work. Selecting Show report turns this page into a Report page with all of the questions listed by page. If PDF grading is enabled, students are able to download a PDF of the report, or email this to a selected recipient.