The Spectral Analysis panel allows Vernier® Science Education’s Go Direct® SpectroVis® Plus Spectrophotometer to sample data into Lt. This new panel means that your students can record spectral data quickly and easily using a portable and affordable spectrophotometer! Not only that, but subsequent data analysis is simple due to the built-in tools Lt provides.
For those students who are working remotely, or simply do not have access to a spectrophotometer, the panels are configured to display example data in existing labs.
Note: Spectral Analysis sampling is only supported on Windows 10 or later. The spectrophotometer will only sample data into Lt via USB. Bluetooth sampling is not available in Lt.
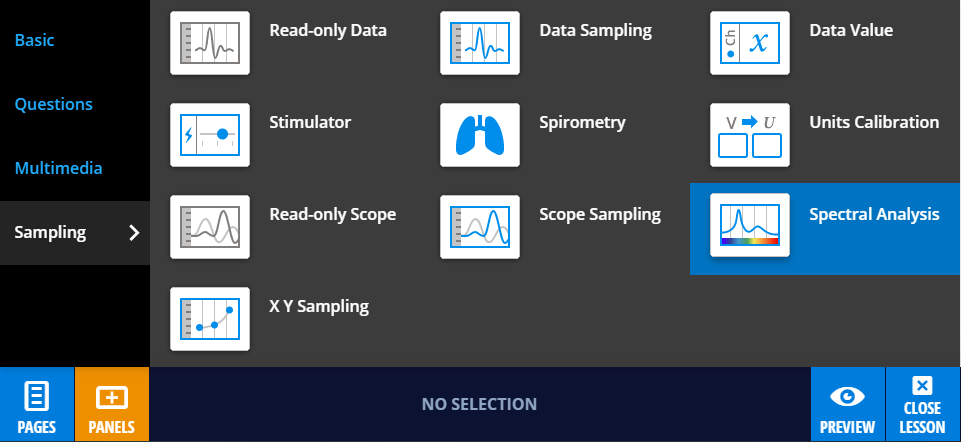
To add a Spectral Analysis panel to your lesson, select PANELS in the footer, and then select Sampling from the PANELS menu. Drag and drop the Spectral Analysis panel icon to wherever you like on the lesson page.
The Spectral Analysis panel can collect data in two modes: Absorbance over Wavelength, and Absorbance over Time. The default mode of the panel is Absorbance over Wavelength. You can change the mode by using the dropdown menu in the footer.
Both modes will require you to calibrate the spectrophotometer. To do this, simply select the Calibrate button and follow the instructions. You will need a cuvette filled with the solution you want to act as a blank.
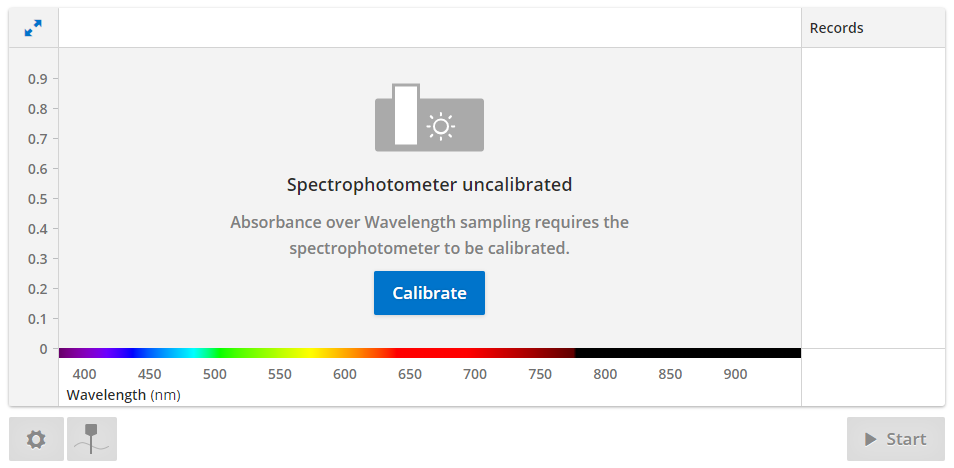
The Absorbance over Wavelength mode measures the absorbance of a sample at every wavelength in the visible spectrum to give an overall spectral profile. In contrast, the Absorbance over Time mode measures the absorbance of a sample at a single wavelength over time. For this measurement to happen, you will need to select the desired wavelength. You will do this after calibration.
The dialog box will display a preview of the spectral profile of the sample. You are able to either select and drag the point selector to the point of maximum absorbance, or type the relevant wavelength into the text box.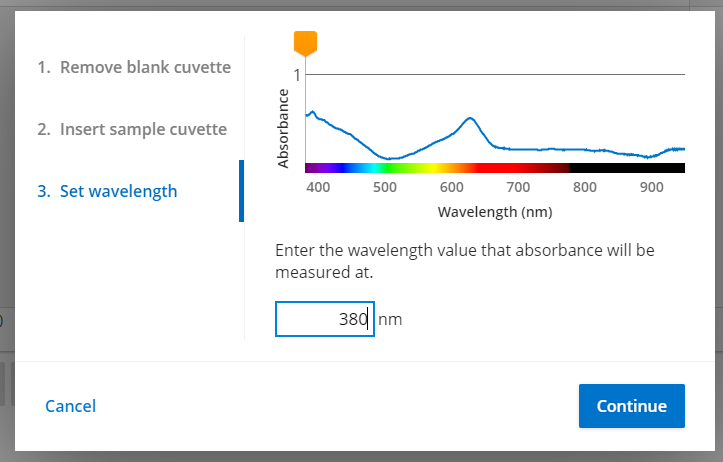
Once chosen, the wavelength will be displayed beneath the panel.
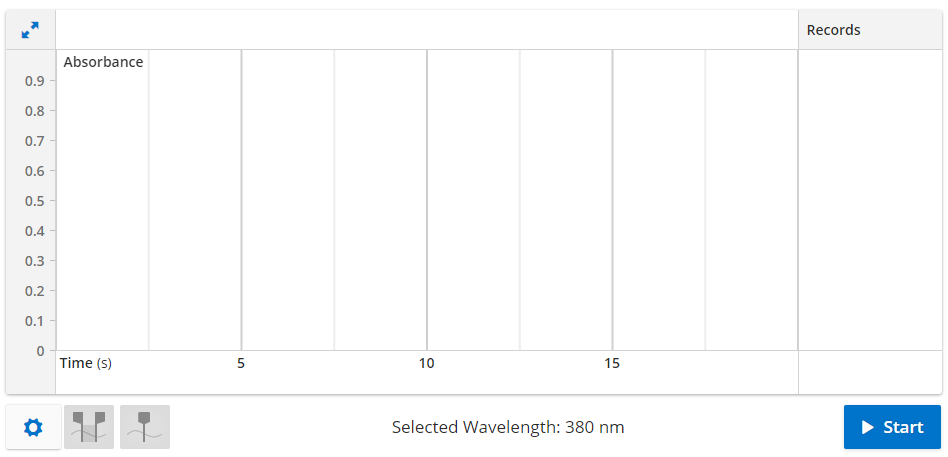
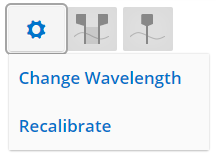
You can also reset the wavelength in the Absorbance over Time panel if, for example, you accidentally selected or typed the wrong wavelength, or if you need to test solutions with different maximal absorbances. To do this, select the cog icon, then select Change Wavelength. Note that this will delete your sampled data.
Once your device is calibrated (and you have selected a wavelength, if using the Absorbance over Time mode), you will be able to begin data collection. Simply select Start and Stop to begin and end data collection.
For Absorbance over Wavelength, selecting Start will create a live spectral profile in the panel.
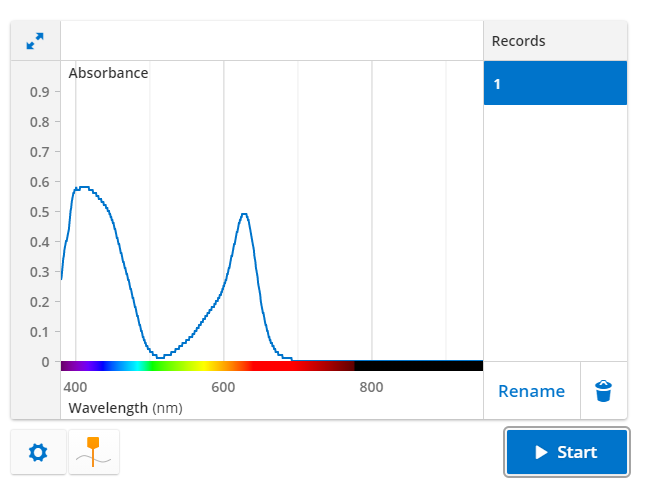
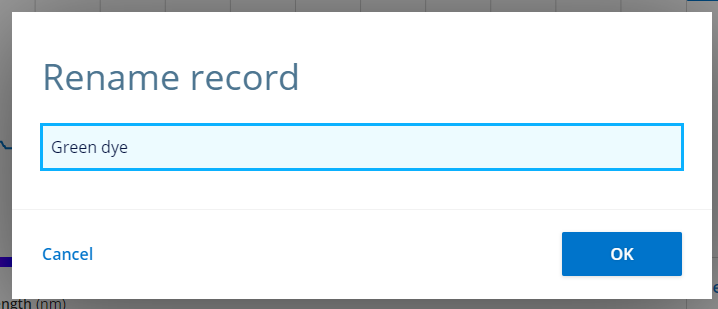
You are able to rename a record by selecting the desired record, then selecting Rename. Enter the desired name, then select OK.
To delete a record, select the desired record, then select the “trash can” icon.
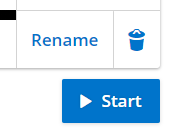
Be careful, as deleted records cannot be recovered.
To enable you to better view your data, you are able to increase the size of the panel to fullscreen by selecting the “double arrow” icon in the top left of the panel.
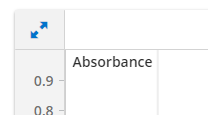
You can see absorbance, time, and wavelength value readouts beside their names in the panel.
In the Absorbance over Time mode, you can use both the region selector and point selector tools to analyze your data. The region selector allows you to view an average absorbance over time, while the point selector allows you to see the absorbance at a single point in time.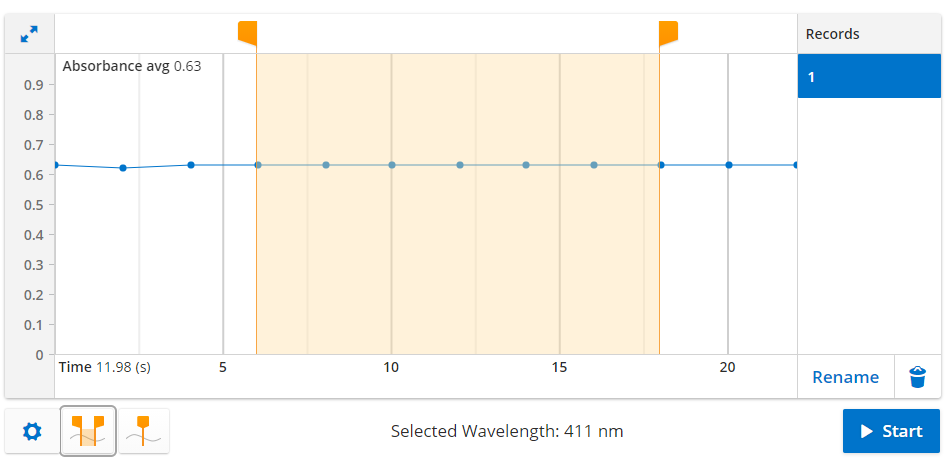
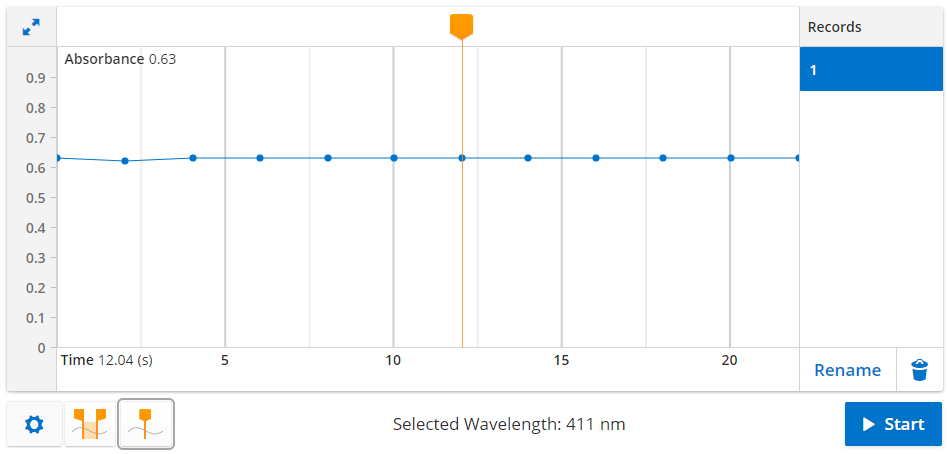
In Absorbance over Wavelength mode, only the point selector is available, because time is not a factor in the plot.
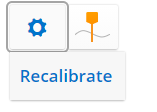
You can recalibrate within the panel if, for example, you calibrated with the wrong blank. To do this, select the cog icon, then select Recalibrate. You will be guided through the calibration process again. You are able to do this in both modes.
If you need to change your blank between activities, it is best to recalibrate on a panel-by-panel basis, to avoid confusion. This is done by using a distinct set of panels for each activity that requires a distinct blank. Pre-existing content will include distinct panels where necessary. If you are building your own lesson, remember not to alias the Spectral Analysis panel between different activities if they will be using different blanks, as they will need to be recalibrated.
You can access example data in relevant, pre-existing content in Lt. In Author mode, simply hold down the SHIFT key, then select the Start button.
To view the example data, select Use Example Data.
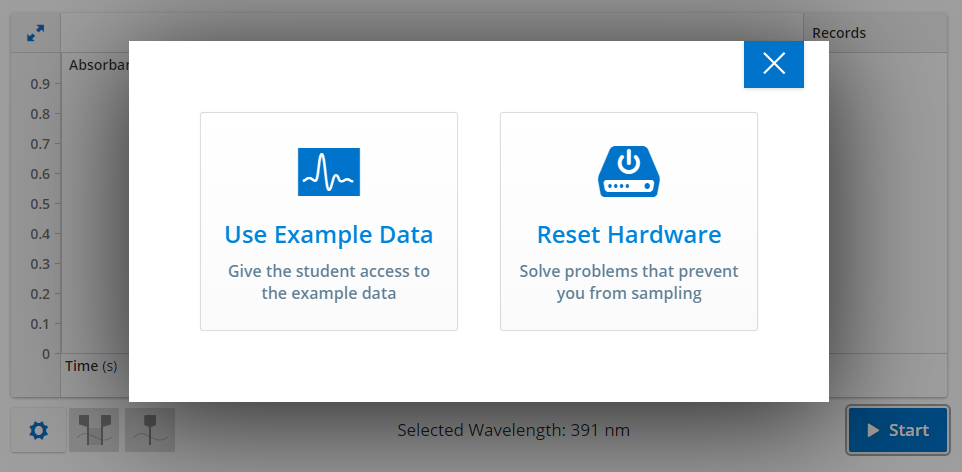
To return to data collection mode, simply hold down SHIFT again and select the Start button.