Current guidelines in Canada recommend the average person should exercise for 30-60 minutes per day, including resistance and flexibility training. However, a recently released study states that a minimum of 60-90 minutes continuous vigorous exercise is required to maintain weight and protect the cardiovascular system. For those with existing cardiovascular conditions, exercise is a commonly prescribed effective and cost-efficient treatment. However, in both healthy individuals and outpatients with coronary disease, adherence to exercise regimes at home is low; either due to lack of time, poor time management or disease-related issues.
Dr. Maureen McDonald at McMaster University in Canada is conducting research to discover alternative methods of exercise for the average Canadian. This will provide individuals with a more realistic approach for achieving recommended exercise goals – such as exercising in 10-minute bursts that add up to 60-90 minutes per day.
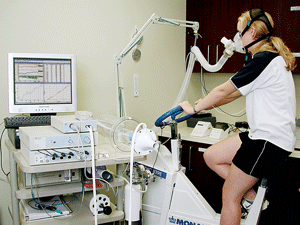
To further these studies, Dr. McDonald and PhD student, Katharine Currie, are using PowerLab systems to investigate more effective and realistic exercise strategies for the treatment of coronary heart disease. They will examine a number of different exercise bursts with different durations (such as sprint interval and aerobic interval training) in order to determine which is most effective and time-efficient. The following images are examples of data from their study.
To investigate the effects of different aerobic exercise intervals, the subjects’ femoral artery velocity, dorsalis pedis artery velocity, blood pressure, ECG, and heart rate were measured. The ECG Analysis Module and Blood Pressure Module were used to analyze the data.
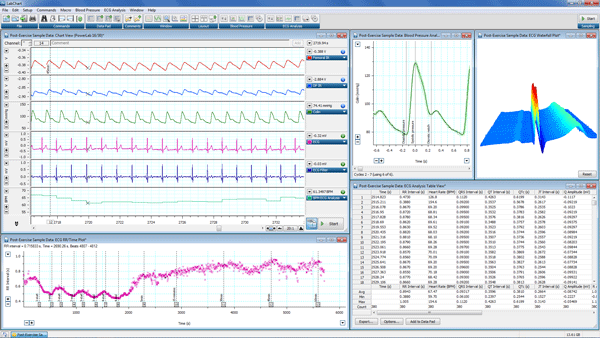
Chart View (Top Left) shows femoral artery velocity (Channel 1), dorsalis pedis artery velocity (Channel 2), blood pressure (Channel 3), ECG (Channel 4) and heart rate (Channel 6). ECG Analysis RR Time Plot (Bottom Left) shows the changes in RR intervals throughout the experiment. Also shown are the Blood Pressure Analysis View (Top Middle), the ECG Analysis Waterfall Plot (Top Right) and the ECG Analysis Table View (Bottom Right) shows the various ECG parameters extracted from the recorded ECG signal.
Flow-mediated dilation was determined using the mean blood velocity (recorded in LabChart) and the changes in artery diameter (calculated from an ultrasound). The Video Capture module in LabChart was used to record the brachial artery ultrasound. Examples of the LabChart data can be seen below.
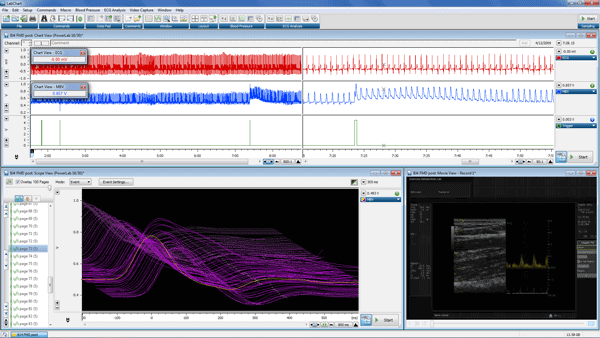
Chart View with Split Bar (top) shows ECG (Channel 1), mean blood flow velocity at baseline (Channel 2) and when the arm pressure cuff is inflated and deflated indicated by the trigger (Channel 3). Scope View (bottom left) shows changes in the mean blood velocity with each heartbeat. Movie View (bottom right) shows the ultrasound image of the brachial artery.
This study aims specifically to establish which exercise strategy results in the greatest change in the cardiovascular parameters of an individual with coronary heart disease. The superior strategy will be implemented in a future study to examine its effect on cardiovascular function after weeks of chronic training. The integration of McDonald’s current and future studies will provide insight for the development of effective and realistic exercise strategies for treatment of coronary heart disease outpatients.