ECG Analysis
ECG / EKG Analysis Software
The ECG (EKG) Analysis Module for LabChart automatically detects and reports PQRST onset, amplitude and intervals in real time, or after recording.
Download SoftwareOverview
Using the ECG Analysis, HRV and Cardiac Axis tools
LabChart’s ECG Analysis Module provides you with an accurate and powerful way to interpret ECG waveform morphology in order to support a wide range of cardiovascular research areas such as:
- Arrhythmia studies
- Cardiovascular disease and myocardial dysfunction
- Pharmacological impact on heart health
- Heart rate variability (HRV)
- Cardiomyopathy
- Hypertension
- Exercise and metabolic studies
- Obesity
- Animal performance and stress
- Isolated hearts
The analysis software automatically detects and reports on P, Q, R, S, and T wave onsets, amplitudes, and intervals in real-time, or post data recording - allowing you to easily interpret and identify abnormalities in your ECG recordings.
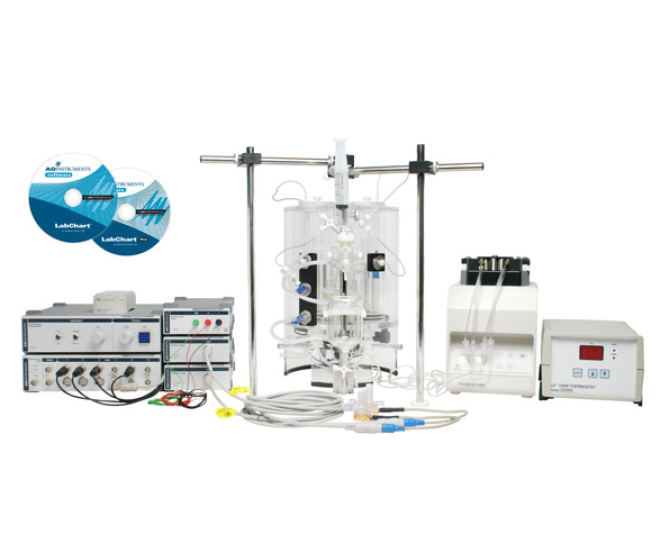
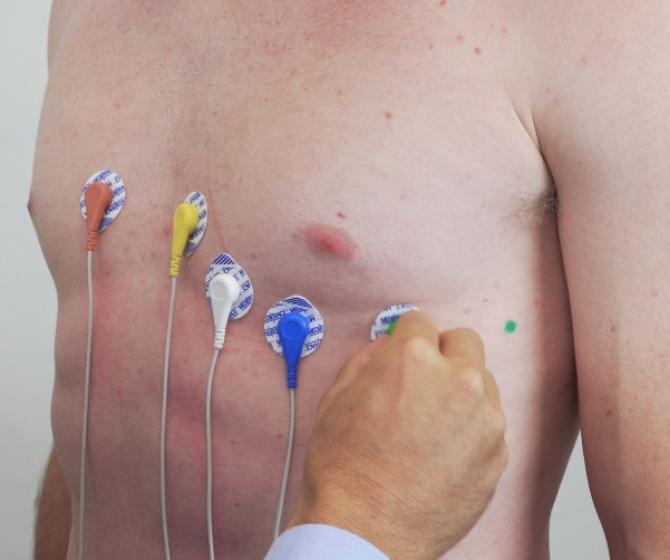
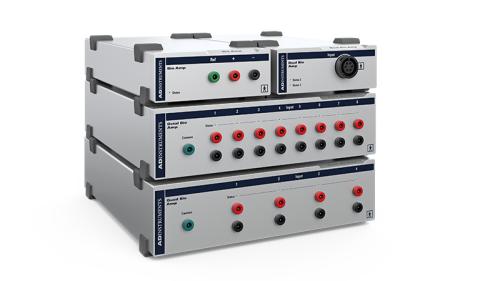
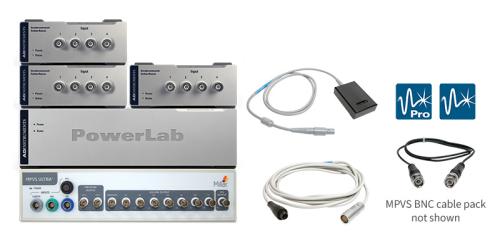
Our software supports measurements from implantable telemetry devices as well as surface and intracardiac electrodes - combined with our Bio Amplifiers to ensure a clean ECG signal. Recordings can be analyzed with our pre-existing detection settings covering a variety of different animal models including:
- Human
- Pig
- Dog
- Rabbit
- Guinea pig
- Rat
- Mouse
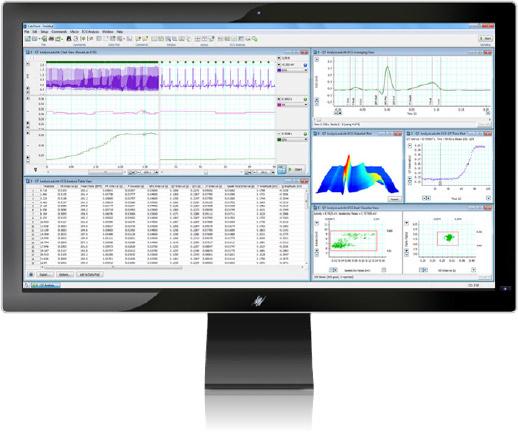
Furthermore, the raw data is unaltered by calculations, ensuring that the electrocardiogram can be reanalyzed. The ECG Analysis Module is suitable for a PC running Windows and is included as part of LabChart Pro or can be purchased separately. The Chart, Beat Classification, Table and Averaging Views are linked for swift and uncomplicated navigation to data points of interest, with easily perceptible manual/user data edits marked in red.
Get the most out of your cardiovascular data by combining the ECG Analysis Module with some additional LabChart Modules such as:
Cardiac Axis - a heart axis calculator add-on for LabChart that automates calculation of frontal plane electrocardiograms and animates cardiac vector display.
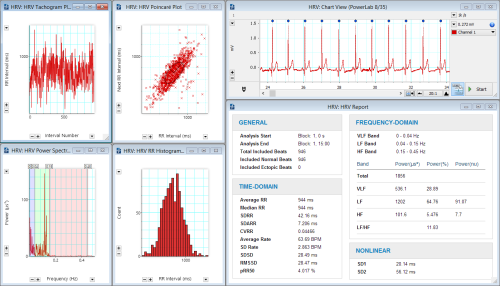
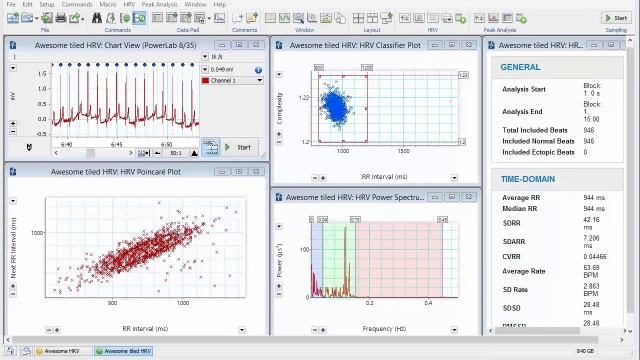
HRV - the R-wave threshold detector identifies and calculates ECG beat-to-beat interval variation to automatically categorize beats as normal, ectopic, or artifact (can also be used with arterial pulse signal).
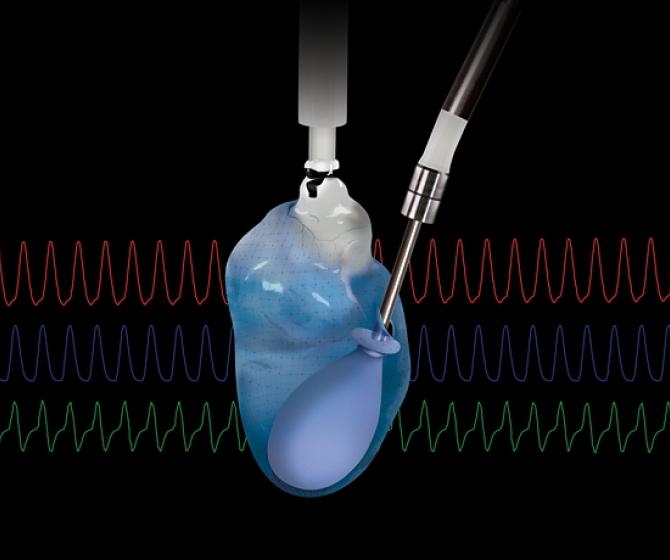
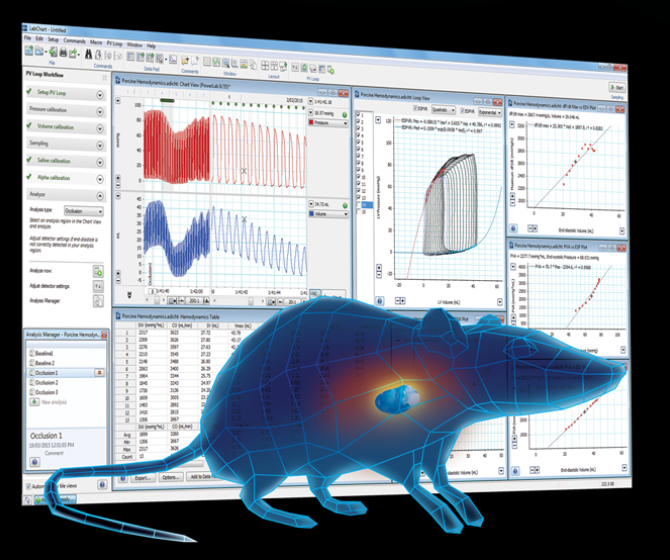
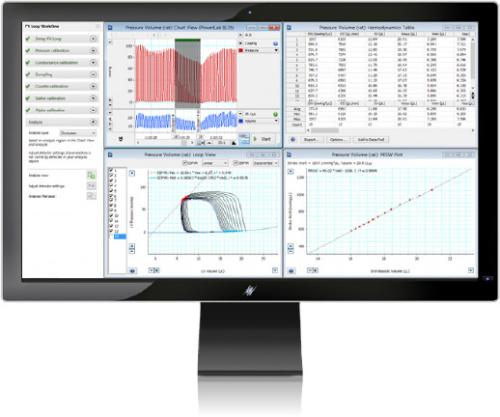
PV Loop - specifically designed for the analysis of in vivo ventricular pressure-volume data in small and large animals, or ex vivo, using working heart systems.
Peak Analysis - provides automatic detection and analysis of multiple, non-overlapping signal peaks.
A Powerful Platform for ECG Analysis
Our ECG/EKG Analysis Module for LabChart permits easy and rapid evaluation of cardiovascular activity and dysfunction. The module enables the identification ECG waveforms and automatically detects heart rhythm, amplitude, and P-, Q-, R-, S- and T-wave onset. Isolate the artial rate and ventricular rhythym with automated amalysis of P-waves and R-waves increasing the applications of your analysis.
The R-wave threshold detector identifies beat-to-beat intervals and automatically calculates HRV - an emergent measure of health and readiness. Identification of tachycardia and bradycardia is made easy with automated heart rate calculation. The analysis software also allows for the rapid quantification and export of a variety of conduction measures, including:
- RR Interval
- PR Interval
- QT Interval
- QRS Interval
- QTc
- T Amplitude
- P Amplitude
- R Amplitude
The Cardiac Axis Add-On is a powerful package that automates the calculation of frontal plane ECGs. Directional calculations of depolarization, repolarization and deflection allow for fast identification of left axis deviation and right axis deviation, powering your downstream analysis.
The ECG Module can also be used as a cardiology platform for ECG interpretation to assist in the detection of a variety of cardiovascular dysfunctions including arrhythmias, atrial fibrillation, atrial flutter, ischemia, left ventricular hypertrophy, right ventricular hypertrophy, and myocardial infarction. Perform interval analysis to facilitate the diagnosis of severe pathologies. Identify first-degree heart block (AV block) via the detection of prolonged P-R Interval or, second-degree heart block through the detection of intermittently dropped QRS complexes.
Related
Products

Research Applications
Human Exercise Physiology
Wireless EMG
Human Exercise Physiology
Wired Physiological Monitoring
Human Exercise Physiology
Biopotentials and GSR
Human Psychophysiology
Electrocardiography (ECG/EKG)
Human Cardiovascular
Langendorff
Cardiovascular Isolated Heart Systems
In Vitro Pharmacology + Isolated Tissue and Organs
Working Heart
Cardiovascular Isolated Heart Systems
In Vitro Pharmacology + Isolated Tissue and Organs
Biopotentials
Human Sleep Studies
Electrocardiography (ECG/EKG)
Human Autonomic
Small Animal Telemetry
Animal Telemetry
Isolated Organ
In Vitro Pharmacology + Isolated Tissue and Organs
Surface ECG
Cardiovascular Cardio Electrophysiology
ECG
Animal Autonomic
HRV
Animal Autonomic
Biopotentials
Animal Telemetry
Optogenetics
Animal Telemetry
Signals
Key Features
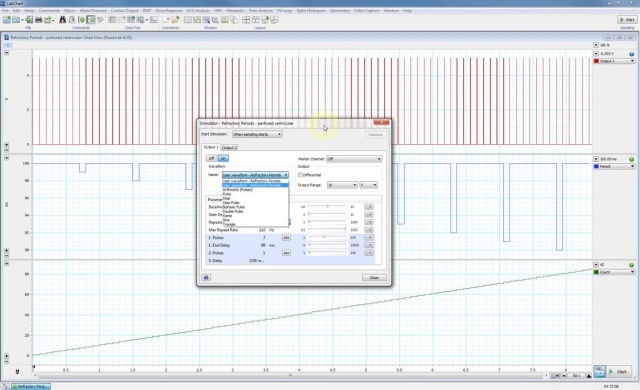
ECG Settings
- Analysis of real-time or saved ECG traces
- Analysis of ECG data from any species, including tailored algorithms for human, rat and mouse ECG analysis.
- Customizable settings for optimal identification of ECG waveforms.
- Automatic detection and averaging of ECG cycles with the option to average a specified number of beats, or all the beats across a specified time period or in a block.
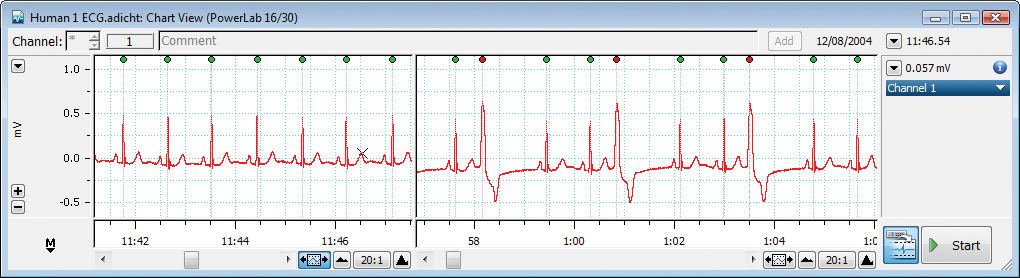
ECG Beat Classification
- ECG Beat Classifier identifies ectopic beats and other cardiac arrhythmias by identifying noise-contaminated waveforms and waveforms with abnormal QRS shapes or RR intervals.
- The first beat marker is always displayed in gray. Beat markers included in analysis are green. Red marker color indicates exclusion from analysis based on signal noise. Blue color indicates exclusion due to form factor, and pink signifies exclusion due to noise as well as form.
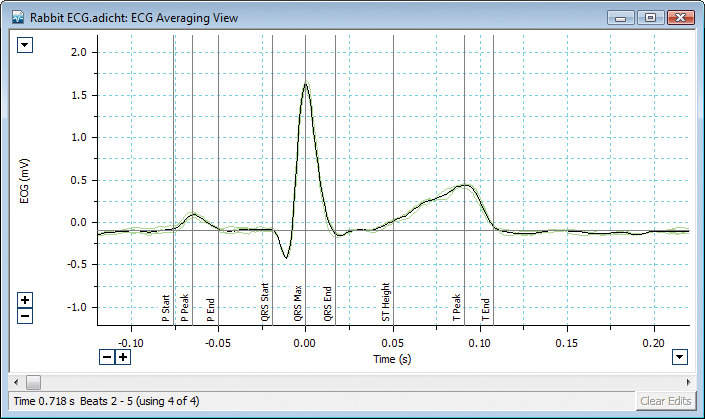
ECG Beat Averaging View
- ECG Beat Averaging View is useful in reducing the effects of noise or movement artifacts and to compare the effects on the ECG before and after experimental intervention.
- Provides automatic logging and displaying of selected ECG parameters of start, end, amplitude and PQRST interval times in tabular and graphical format.
ECG Table View
ECG Table View calculates and records the parameters of each averaged ECG beat that can easily be added to the Data Pad or exported to other graphing or statistical programs. Available parameters include:
- P, Q, R, S, T amplitudes
- Time intervals such as RR, PR, JT,QT and QTc
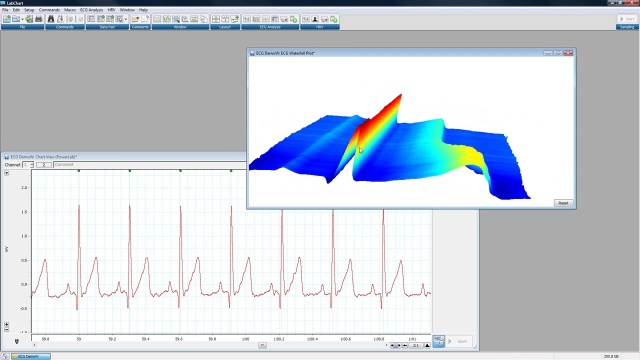
Analysis Plots
Automatic generation of Analysis Plots from calculated parameters:
- QT/RR Plot (QT Interval versus RR Interval)
- QT/Time Plot (ideal for pharmacokinetics)
- RR/Time Plot (indicates HR variance)
- Waterfall Plot (3D waveform analysis)
Support
Support Articles
Our Support Articles contain answers to common questions, how-tos, solutions, and documentation.
Training and Workshops
Maximize time and resources with our customized training services delivered at your facility, on your equipment, on your terms.

Details and Tech Specs
Technical
Compatibility
| LabChart 8 for Windows | checkmark |
| LabChart 8 for Mac | - |