Blood Pressure
Measure & Analyze Blood Pressure
The Blood Pressure Module for LabChart acts as a blood pressure graphing, monitoring & tracking software, automatically reporting cardiovascular parameters from arterial or ventricular pressure signals.
Download SoftwareFrequently purchased with Blood Pressure


Overview
The Blood Pressure Module for LabChart automatically detects, analyzes and reports a set of cardiovascular parameters from arterial or ventricular pressure signals. It can be used for experiments involving invasive arterial blood pressure monitoring and a range of related applications. Analysis can run during recordings, or after.
LabChart also displays parameters calculated by the BP Software Module as continuous data on separate channels. Raw data is unaltered by any calculation ensuring recorded ventricular or arterial pressures can be reanalyzed anytime.
The Blood Pressure Module is included as part of LabChart Pro or can be purchased separately.
Related
Research Applications
Cardiovascular Hemodynamics
Ventricular Pressure Volume + PV Loops
Cardiovascular Hemodynamics
Non-Invasive Blood Pressure
Human Exercise Physiology
Human Invasive Blood Pressure Monitoring
Human Cardiovascular
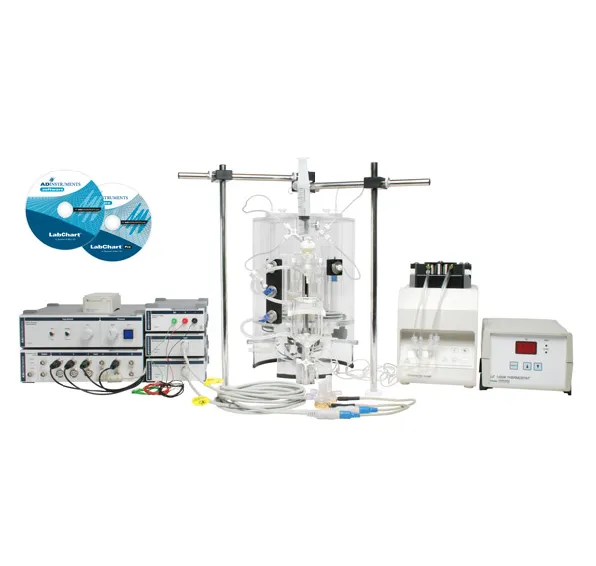
Langendorff Isolated Heart Perfusion Systems
Cardiovascular Isolated Heart Systems
In Vitro Pharmacology + Isolated Tissue and Organs
Working Heart
Cardiovascular Isolated Heart Systems
In Vitro Pharmacology + Isolated Tissue and Organs
Respiratory
Human Sleep Studies
Human Non-invasive Blood Pressure (NIBP)
Human Autonomic
Small Animal Telemetry
Animal Telemetry
Isolated Organ
In Vitro Pharmacology + Isolated Tissue and Organs
Blood Pressure
Animal Autonomic
HRV
Animal Autonomic
Sympathetic nerve activity (SNA)
Animal Telemetry
Signals
Key Features
- Blood and cardiac pressure can be analyzed in real time during data acquisition.
- Suitable for analysis of blood pressure from humans as well as large and small animals.
- Calculated pressure parameters can be displayed on separate channels in LabChart as a continuous data.
- Raw data is unaltered by any calculations ensuring that the ventricular or arterial signals can be re-analyzed at any time.
- Blood Pressure Classifier View allows cycle to be selected based on height and duration. This is useful for detection and exclusion of atypical waveforms and to select pressure cycles that have increased frequency and/or amplitude for analysis.
- Option to average any number of pressure waveforms is available to eliminate noise.
- Blood Pressure Analysis View displays labeled arterial or ventricular pressure parameters beat-by-beat or as the average of a specified number of cycles. Each beat or an average of successive beats can be viewed using the horizontal scrolling bar.
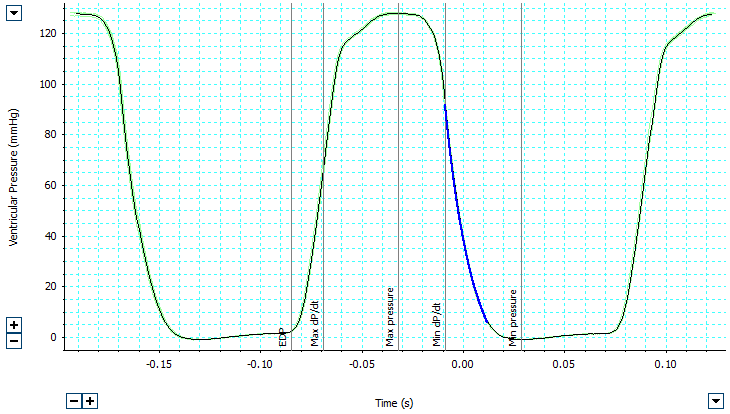
- Parameters marked on ventricular cycle are
- End diastolic pressure
- Maximum dP/dt
- Maximum pressure
- Minimum dP/dt
- Minimum pressure
- Tau
- Parameters market on arterial cycle are
- Diastolic pressure
- Systolic pressure
- Dicrotic notch
- Blood Pressure Table View logs all calculated pressure parameters in real time. Table rows are linked to various LabChart windows. Highlighting a row will automatically show the corresponding beat in the Analysis View and LabChart View data.
- The Blood Pressure Settings dialog allows easy configuration of detection and analysis parameters for ventricular or arterial pressure recordings. The detection algorithm uses minimum cycle height and duration, with each detected cycle labeled and specific waveform parameters automatically calculated. Cycle averaging and isovolumic relaxation (Tau) options are also set in the dialog.
- Calculated ventricular waveform parameters includes
- Maximum Pressure
- Minimum Pressure
- End Diastolic Pressure (EDP)
- Maximum dP/dtMean Pressure
- Maximum-Minimum Pressure
- Systolic Duration
- Diastolic Duration
- Cyclic Duration
- Heart Rate
- Maximum dP/dt
- Contractility Index
- Minimum dP/dt
- Isovolumic Relaxation Period Average dP/dt
- Tau
- Pressure Time Index
- Calculated arterial waveform parameters includes
- Systolic Pressure
- Diastolic Pressure
- Dicrotic Notch Pressure
- Mean Pressure
- Pulse Pressure
- Ejection Duration
- Non-Ejection Duration
- Cycle Duration
- Heart Rate
- Time to Peak
Support
Support Articles
Our Support Articles contain answers to common questions, how-tos, solutions, and documentation.
Training and Workshops
Maximize time and resources with our customized training services delivered at your facility, on your equipment, on your terms.
Details and Tech Specs
Technical
Compatibility
LabChart 8 for Windows | checkmark |
LabChart 8 for Mac | - |
Product Code
Software
Brochures
Requirements
The Blood Pressure Module should be used with the latest version of LabChart.
The Blood Pressure Module is also available as part of LabChart Pro. The LabChart Pro software package includes all LabChart Modules. Existing LabChart users and PowerLab system purchasers can upgrade to LabChart Pro at a special price. If you need more information please contact us.