A deeper understanding of the molecular processes that lead to cardiac hypertrophy offers hope for millions of individuals worldwide.
Cardiac hypertrophy is the abnormal enlargement, or thickening of the heart muscle, in response to an increase in cardiac workload. There are several conditions that can cause your heart to work harder than normal. The most common being high blood pressure (hypertension), which affects approximately ⅓ of the adult population globally 1.
If left untreated, cardiac hypertrophy will eventually progress to heart failure (HF), a condition where the heart is no longer able to pump enough blood to meet the body’s needs.
However, controlling hypertrophic growth has proven to be effective at reducing the risk of developing HF 2.

Because cardiac hypertrophy develops gradually, there is a relatively long time frame between the onset of the disease to the development of HF. This provides a window of opportunity to slow or even reverse the progression of cardiac remodeling in these patients displaying the early stages of the disease.
The heart of the problem
A fundamental problem in the effective treatment of cardiac hypertrophy is our limited understanding of the key molecular processes involved in the development of the disease.
The current treatment options for controlling hypertrophic growth involve targeting the extra-cardiac factors, such as high blood pressure. For example, Angiotensin-converting-enzyme, or ACE inhibitors, are commonly used to reduce blood volume and pressure, lowering the overall demand on the heart to pump blood.
While this may be an effective treatment for some people, there are no clinically available treatment options that target the intra-cardiac factors mediating hypertrophic growth.
Dr. Min Zi, a Researcher in the Division of Cardiovascular Sciences at Manchester University (UK), is one such scientist who is actively investigating these intra-cardiac factors. It was through Min’s experience as a clinical cardiologist that initially got her interested in this area of research.
‘I initially trained as a cardiologist as I wanted to help the people suffering from heart disease and its symptoms. However, working in the clinical setting, I was finding that my treatment options for helping patients were incredibly limited. This motivated me to look for the root cause of the disease, with the view of discovering new treatment options to reverse or even cure the disease.’

Using a variety of techniques including animal models of ventricular hypertrophy, gene knockouts, and hemodynamic analyses - Min and collegues have successfully identified some key proteins involved in the development of cardiac hypertrophy as well as potential drug targets and therapies for treating the disease 3,4,5.
The power of the PV Loop - A visual representation of disease progression
Min regularly uses ventricular pressure-volume (PV) analyses to characterize and study cardiac hypertrophy.
PV Loops are generated by inserting a pressure-volume catheter into the left or right ventricle of the heart and plotting the real-time ventricular pressure against ventricular volume over a complete cardiac cycle.
While PV Loops may appear to be a relatively simple-looking graph, they can provide you with a wide array of information regarding cardiac function and performance, and can even be used to evaluate certain cardiac diseases.
Min explains that during the early stages of cardiac hypertrophy, the changes in ventricular pressure and volume cause the PV Loop data to take on a distinctive shape.
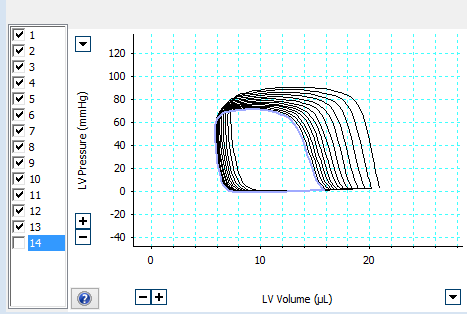
A typical series of left ventricular PV Loops displayed in LabChart.
‘As the demand on the heart increases, the cardiac tissue responds by remodeling itself and growing more biomass. As a consequence, in the first stages of the disease, the strength of each contraction may be more forceful than normal during the systolic phase of the cardiac cycle.’
This change in contractility can be measured by the slope and position of the end-systolic pressure-volume relationship (ESPVR) on the PV loop graph (as depicted on the right).
‘However, as the cardiac tissue grows, it also becomes more stiff to compensate for an increase in pressure/resistance in the aorta. As the disease progresses, the ability of the cardiac tissue to relax and fill up with blood weakens, resulting in reduced diastolic function of the heart, as measured by the EDPVR line on the graph.’
‘As the heart can no longer fill properly with blood during diastole, there is more and more pressure on the heart to increase the strength of contraction to pump more blood out to the body during systole.''
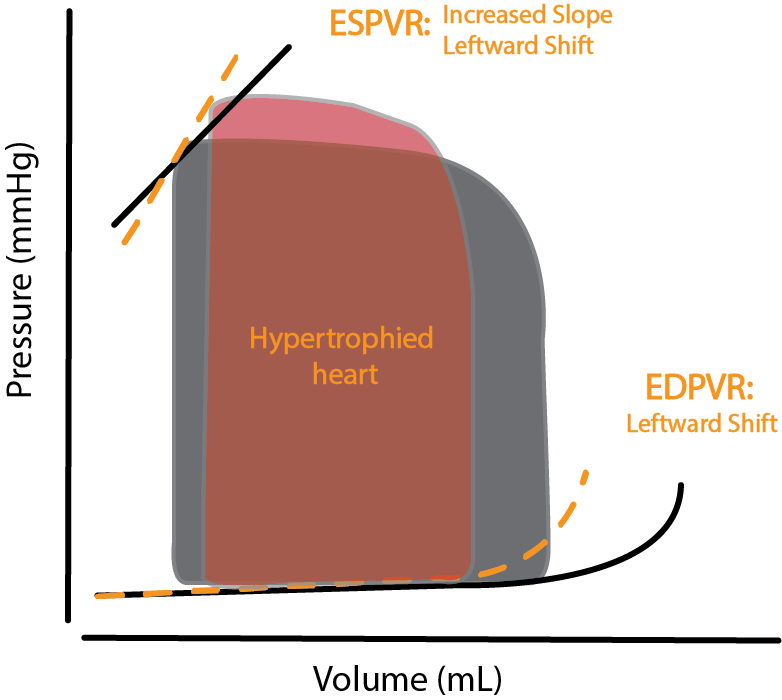
PV Loop of a healthy (grey) vs. hypertrophied heart (red).
'This repeats in a vicious cycle until the systolic function of the heart is also compromised, eventually leading to heart failure.’
By having a clear understanding of how ventricular pressure-volume changes in relation to disease progression, Min and her team can investigate whether certain treatments are having a positive effect in controlling or reversing hypertrophic growth by analyzing changes to the PV Loop data.
A novel therapeutic for cardiac hypertrophy
It was by using PV Loop analysis in combination with other hemodynamic tools like echocardiography that Min and her colleagues discovered a potential new therapeutic for combating hypertrophic growth. More specifically, they showed that the immunomodulating drug FTY-720 (or Fingolimod), commonly used for treating Multiple sclerosis, was also effective at reversing cardiac hypertrophy and fibrosis.
In this particular study, they found mice that had undergone transverse aortic constriction (TAC); an experimental model for pressure overload-induced cardiac hypertrophy and heart failure, showed significant improvements in cardiac performance and a reduction in ventricular mass when treated with FTY-720.
You’re only as good as your tools... The importance of high-quality equipment
An integral part of Min’s work is having the right technology on hand to collect high-quality, conclusive data. Min first came across ADInstruments technology 15 years ago when the University of Manchester was looking to upgrade its research equipment and facilities.
‘For me, it’s particularly important that the equipment we have is reliable. Since day one, we have been extremely happy with ADInstruments staff and equipment- I am still using the PowerLab I bought 15 years ago! I like that many of the tools, such as LabChart, are extremely user-friendly and intuitive.’
When measuring her PV Loop data, Min needs reliable and accurate equipment for detecting the subtle changes in pressure and volume over the course of an experiment. She uses Millar’s research Catheters for their quality and reliability when it comes to gathering PV Loop data.
‘Millar catheters are a very high-quality piece of equipment that can last a long time if you look after them correctly.' She adds, 'I am extremely careful with mine and have used the same catheter for the last 5 years for thousands of experiments!'
Related: Troubleshooting your Millar Catheter - Three common problems and how to fix them
We at ADInstruments are proud to support scientists like Min who are passionate about improving the lives of millions worldwide. We wish Min and her team all the best for their future studies!
Helpful resources
Introduction to PV loops: Understanding points on the PV loop and measures of cardiac function
Tips and tricks for measuring PV loops in mice
PV catheter placement in the left ventricle - Carotid vs. Apical approach
Understanding pressure-volume catheter calibrations and experimental design
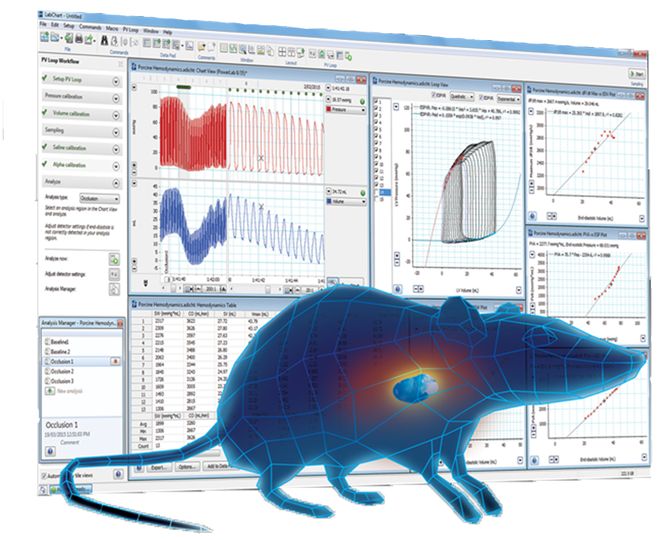
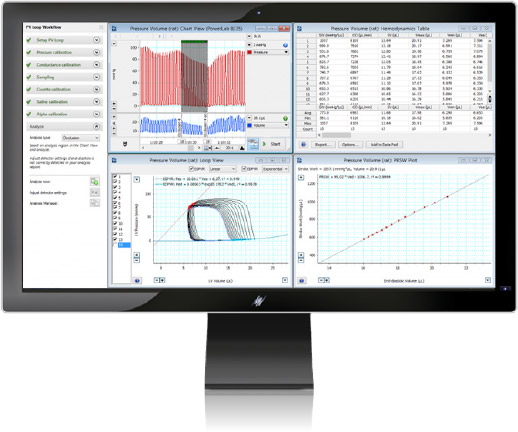
LabChart - PV Loop analysis made easy
LabChart's PV Loop Analysis Module is specifically designed for the analysis of in vivo ventricular pressure-volume data in small and large animals, or ex vivo, using working heart systems.
The PV Loop Analysis Software offers smart presets for different animals and streamlined workflows guiding you step-by-step from calibration through to analysis. Find out more »
References:
1. Mills, T.K. et al. Global Disparities of Hypertension Prevalence and Control: A Systematic Analysis of Population-based Studies from 90 Countries. Circulation 134(6), 441-450 (2016).
2. Mathew, J. et al. Reduction of cardiovascular risk by regression of electrocardiographic markers of left ventricular hypertrophy by the angiotensin-converting enzyme inhibitor ramipril. Circulation 104, 1615–1621 (2001).
3. Mohamed, T.M.A. et al. The plasma membrane calcium ATPase 4 signalling in cardiac fibroblasts mediates cardiomyocyte hypertrophy. Nature Communications 7:11074 (2016)
4. Liu, W. et al. A Novel Immunomodulator, FTY-720 Reverses Existing Cardiac Hypertrophy and Fibrosis From Pressure Overload by Targeting NFAT (Nuclear Factor of Activated T-cells) Signaling and Periostin. Circ Heart Fail 6, 833-844 (2013).
5. Omede, A. et al. The oxoglutarate receptor 1 (OXGR1) modulates pressure overload-induced cardiac hypertrophy in mice. Biochemical and Biophysical Research Communications 479, 708-714 (2016)