HRV
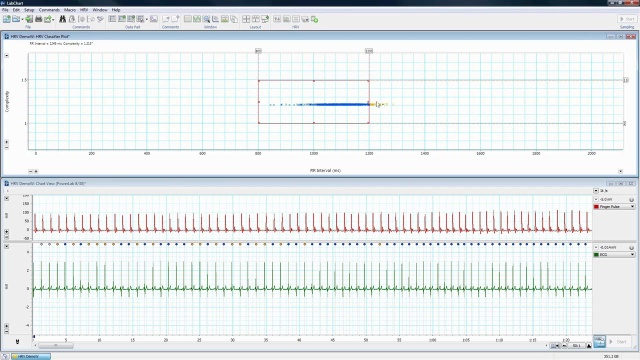
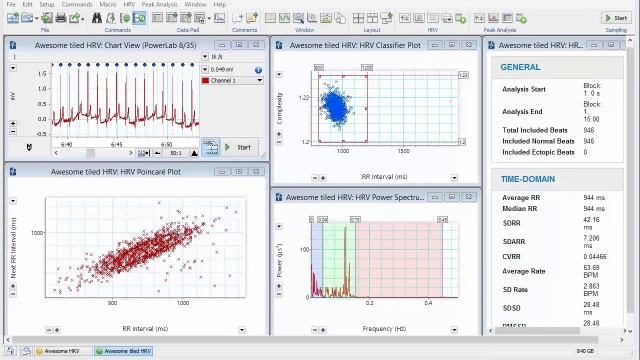
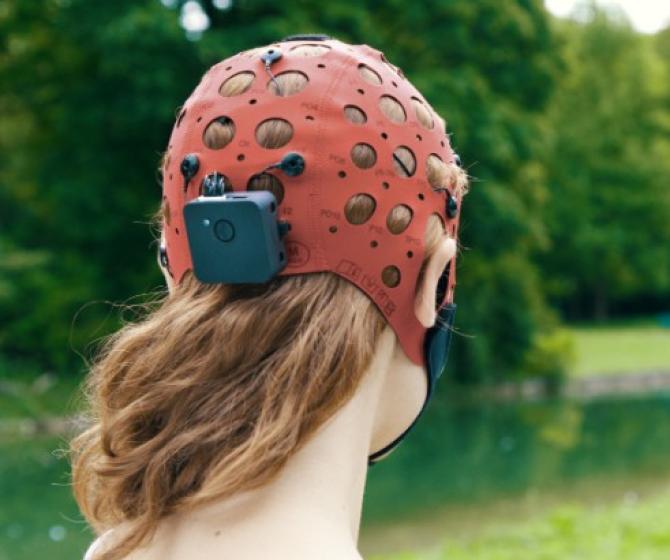
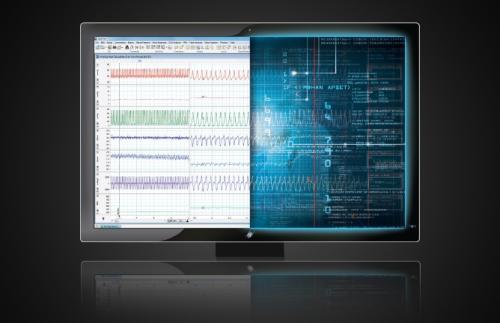
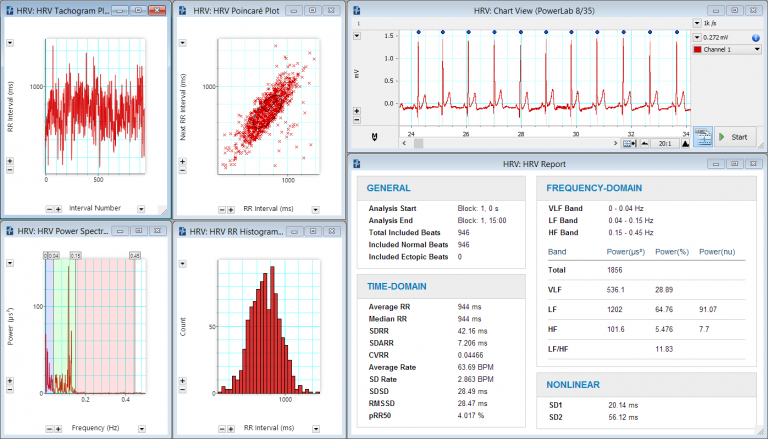
Heart Rate Variability (HRV) is determined by analyzing the time series of beat-to-beat intervals from an electrocardiogram (ECG).
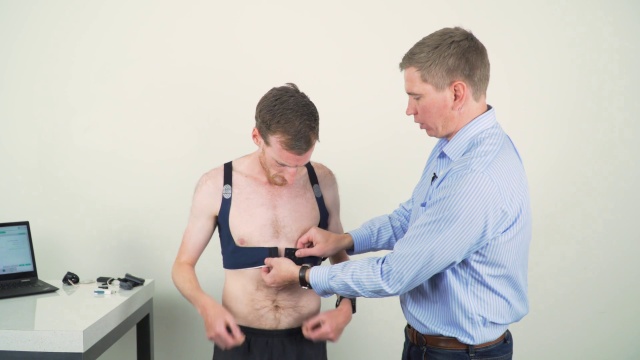
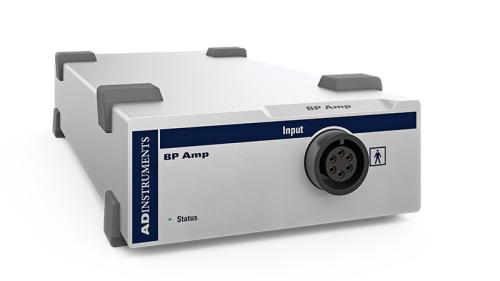
HRV is a popular tool within psychophysiology as it can be an easy indicator to assess the relative contributions of the parasympathetic and sympathetic nerves to the control of basic cardiac rhythm. ECG, blood pressure, or arterial pulse recordings can be used to investigate this interplay between sympathetic and parasympathetic nervous systems.
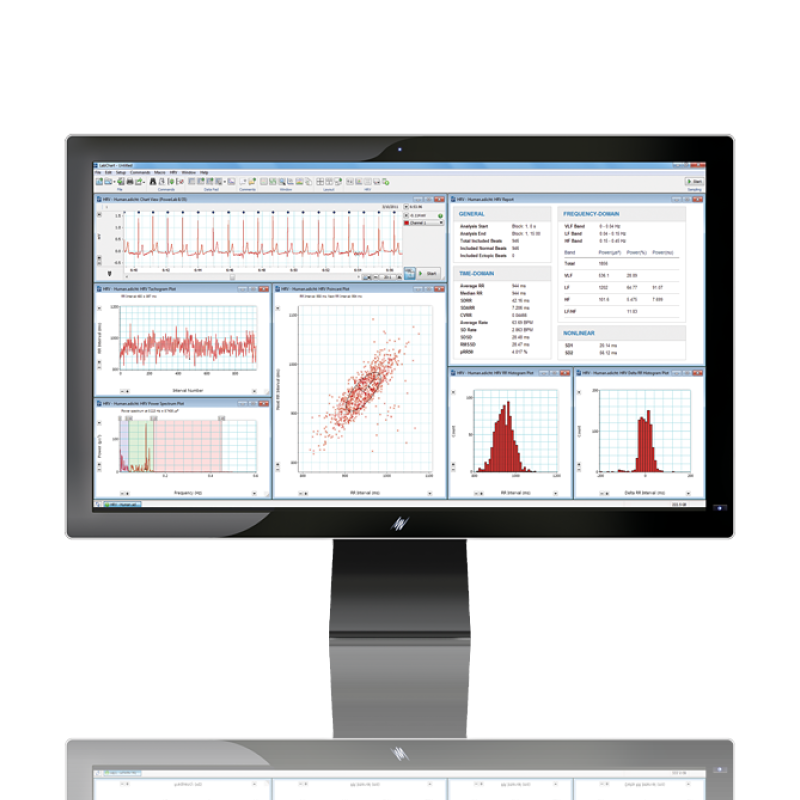
PowerLab and LabChart form a streamlined system to record and analyze heart rate variability (HRV). Run protocols for different stimuli and synchronize with either wireless or wired psychological response data.
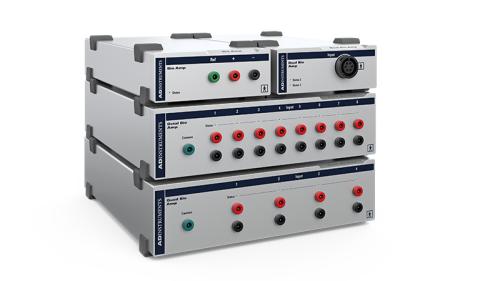
Mix and match
HRV tools for a
custom solution
Integrate with
other physiological
recording options
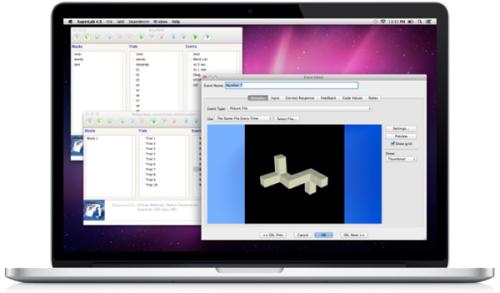
Integrate with stimulus presentation software
In conjunction with our solutions shown below, any device with an analog output (+/- 10V) can be connected to a PowerLab data acquisition system for synchronization of event in LabChart. So you have even more flexibility and can integrate all your data streams in one place.
All of our hardware recommended for human use is backed by the appropriate safety certification standards. More information on safety standards.
Complete Systems or Kits
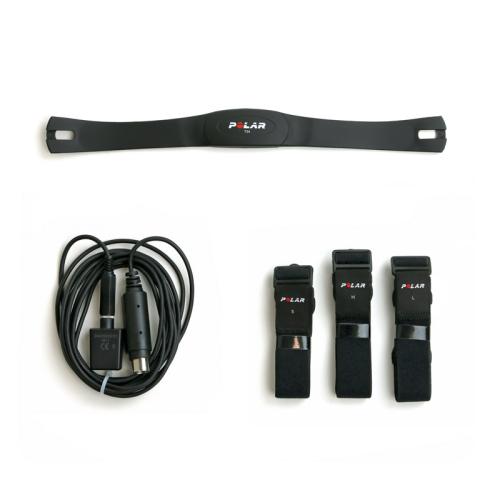
The Polar Wireless Heart Rate Kit offers wireless connectivity (1.2m range) to a PowerLab for accurate real-time measurement of heart rate.
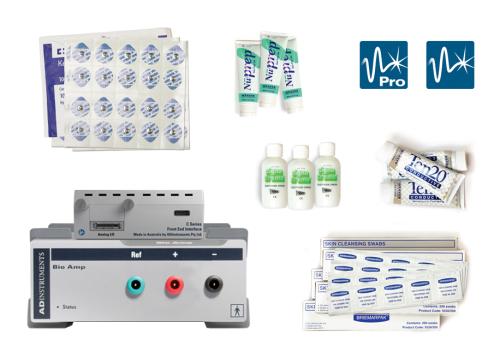
The C Series HRV System includes all the HRV devices, software and sensors you will need to perform Heart Rate Variability Studies. HRV is a biological marker that can be used to study a broad range of psychological and physiological effects in humans.
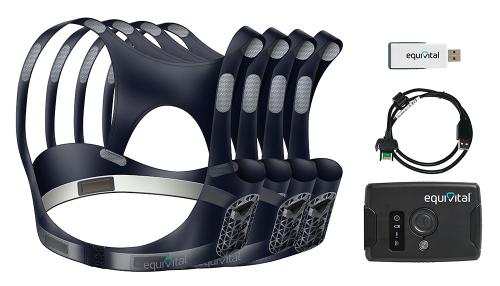
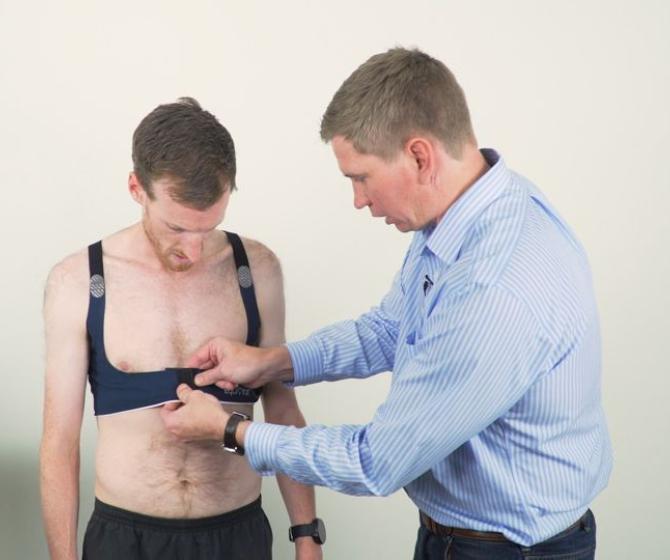
Ideal HRV testing equipment starter solution to record data from a range of individuals or if you are unsure of sizing requirements. Comes with four sensor belt sizing options. Each sensor belt can record 2 channels of ECG alongside other physiological signals.
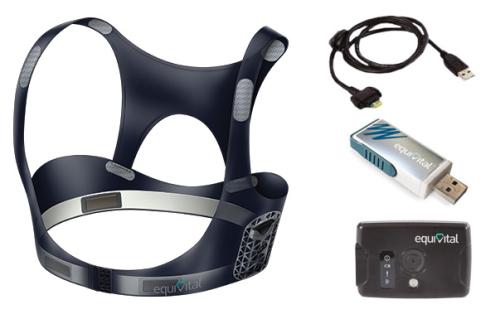
The Equivital Starter Pack (Single) is perfect if you are currently planning to record data from one individual as it comes with only one of Equivital’s compact and unobtrusive wearable ECG sensor belts.
Related Components and Products
Data acquisition and analysis re-imagined. Make unique discoveries with unlimited freedom and flexibility.
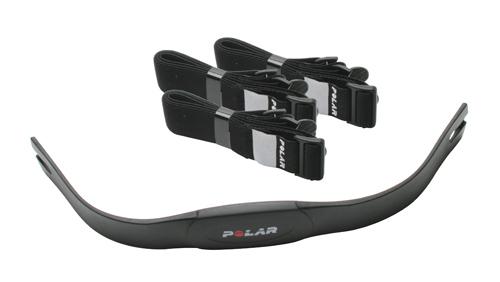
Supplied with the Wireless Heart Rate Kit, patented, ergonomic heart rate transmitter.
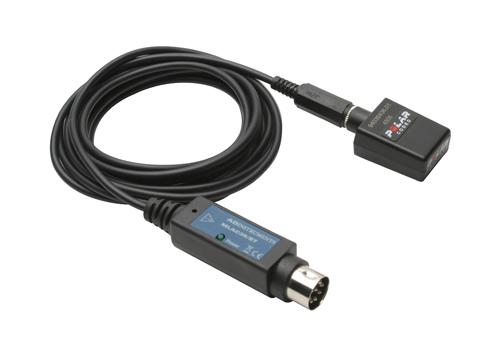
Supplied with the Wireless Rate Rate Kit, connects the PowerLab to Polar Plug-in receiver.

Flexible Data Acquisition
ADInstruments systems provide an integrated solution to advance life science research. With the combination of LabChart or LabChart Lightning analysis software and a PowerLab data acquisition unit, you have the flexibility to collect and synchronize a wide range of signals for analysis. We also offer a range of LabChart compatible solutions able to stream directly in LabChart.
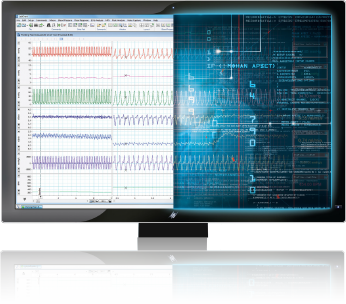
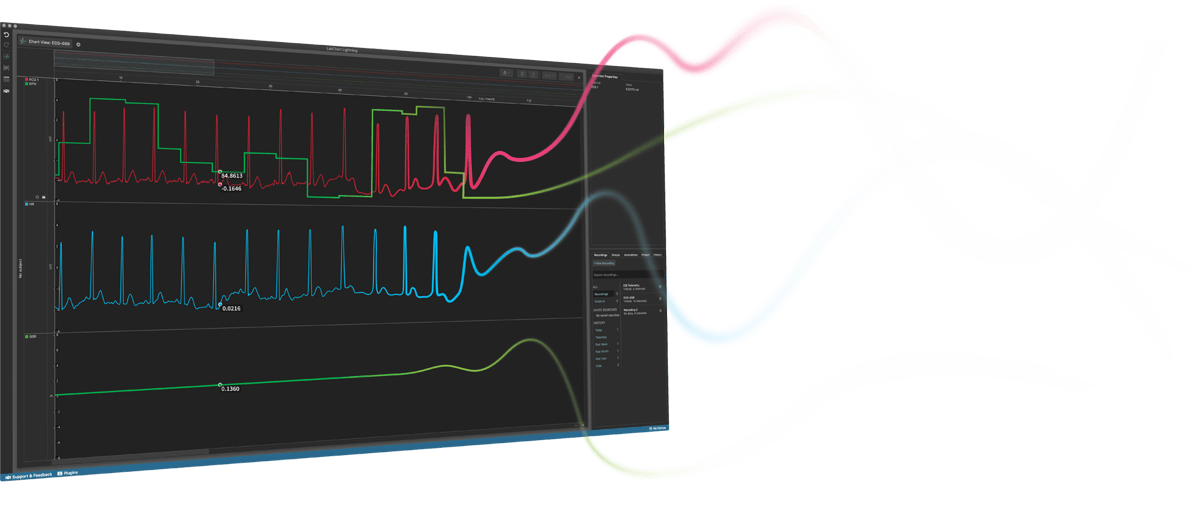
LabChart data analysis software creates a platform for all of your recording devices to work together, allowing you to acquire biological signals from multiple sources simultaneously and apply advanced calculations and plots as your experiment unfolds.
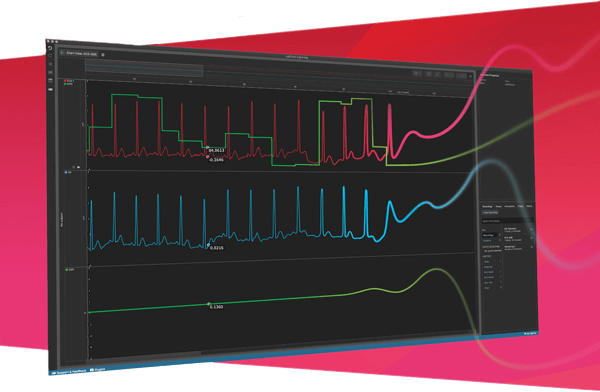
Data acquisition and analysis re-imagined. Make unique discoveries with unlimited freedom and flexibility.
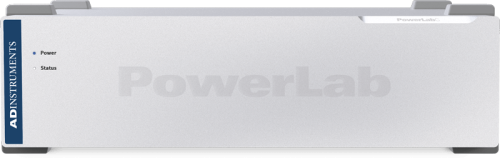
High-performance data acquisition hardware designed for life science research. PowerLab is engineered for precise, consistent, reliable data acquisition, giving you the reproducible data you need while meeting the strictest international safety standards.
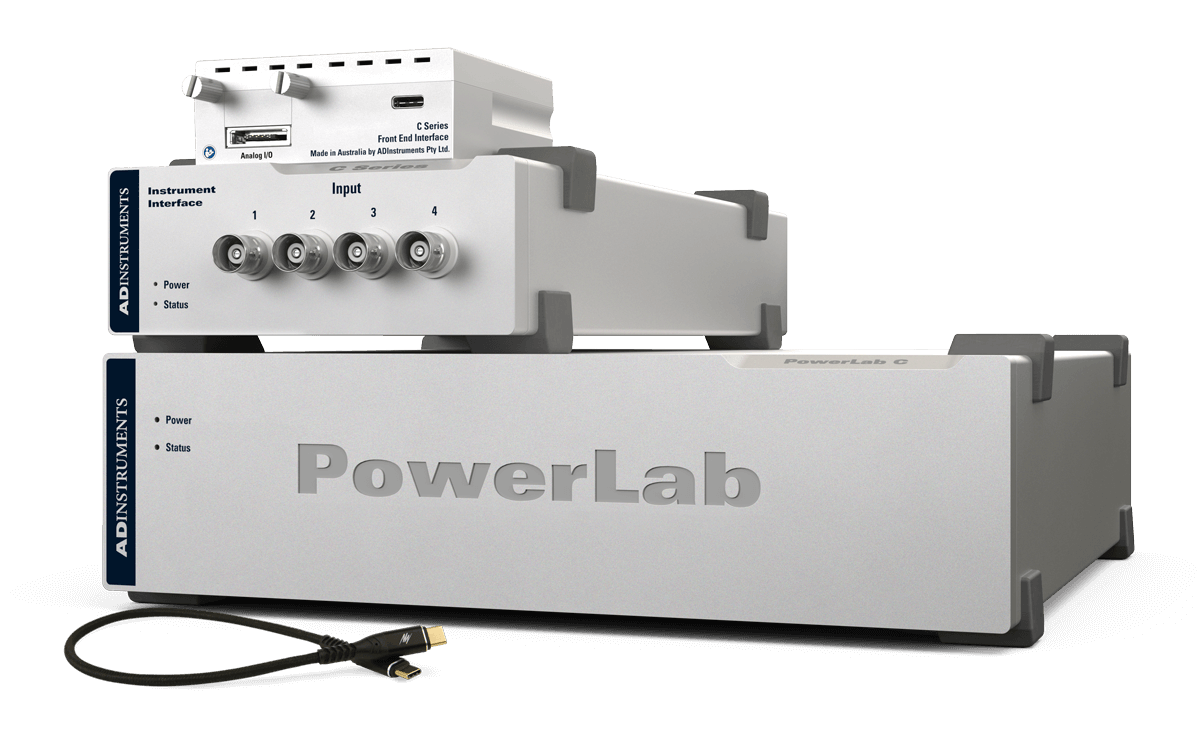
A modular data acquisition foundation system that provides unparalleled flexibility for researchers looking to invest in customizable, reliable solutions for both now, and in the future.
All your analysis in one place
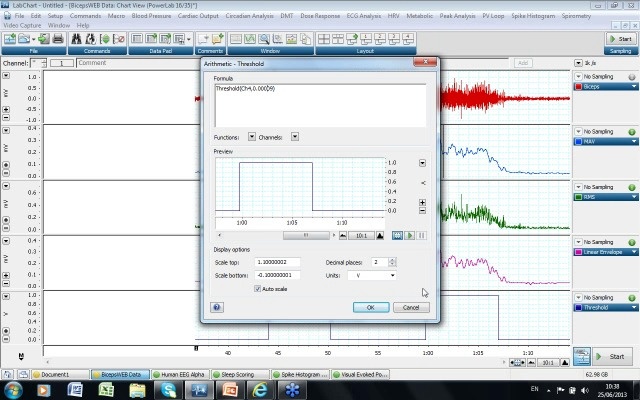
LabChart software is designed specifically for life science data and provides up to 32 channels for data display and analysis options that are powerful and easy to use. With auto-recognition of ADI and LabChart Compatible hardware, multi-window views, one touch recording, simultaneous recording from multiple devices, specialized preconfigured settings, easy sharing options and an interface that can be customized to show only the features you want to use.
Features and Add-Ons
Additional acquisition and analysis options to support your HRV analysis:

Data acquisition and analysis re-imagined.
Make unique discoveries with unlimited freedom and flexibility.