HRV
Heart Rate Variability (HRV) Analysis Software
The Heart Rate Variability (HRV) Module for LabChart analyzes beat-to-beat interval variation in ECG recordings or arterial pulse signals.
Download SoftwareFrequently purchased with HRV


Overview
The Heart Rate Variability (HRV) Module for LabChart analyzes beat-to-beat (RR) interval variation in ECG recordings or arterial pulse signals coming from humans or animals. HRV analysis can be performed on a previous ECG recording or while data is being sampled. The Heart Rate Variability Software Module automatically detects beats by finding the R wave in the ECG signal and classifies beats into Normal or Ectopic based on the presets (or custom settings) the user chooses. Beats can be manually added or removed during the HRV data analysis.
The HRV Module is included as part of LabChart Pro or can be purchased separately.
Related
Research Applications
Human Exercise Physiology
Wireless Physiological Monitoring
Human Exercise Physiology
HRV
Human Psychophysiology
Electrocardiography (ECG/EKG)
Human Cardiovascular
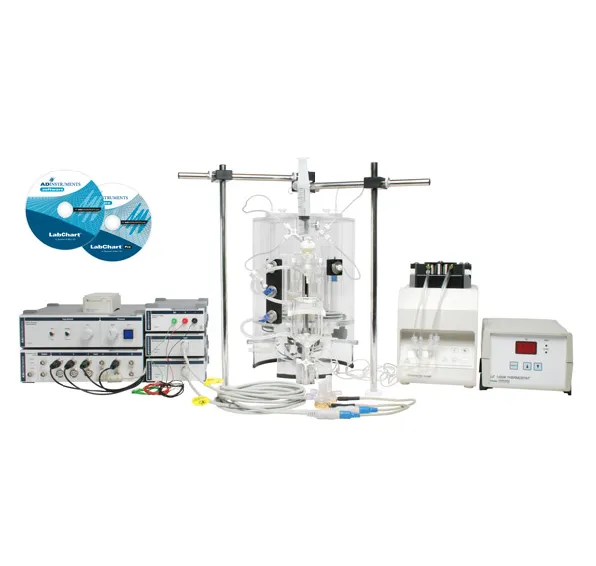
Langendorff Isolated Heart Perfusion Systems
Cardiovascular Isolated Heart Systems
In Vitro Pharmacology + Isolated Tissue and Organs
Working Heart
Cardiovascular Isolated Heart Systems
In Vitro Pharmacology + Isolated Tissue and Organs
Biopotentials
Human Sleep Studies
Respiratory
Human Sleep Studies
Electrocardiography (ECG/EKG)
Human Autonomic
HRV
Human Autonomic
Small Animal Telemetry
Animal Telemetry
Stimulation
Human Neuro
Nerve Recording
Animal Autonomic
Surface ECG
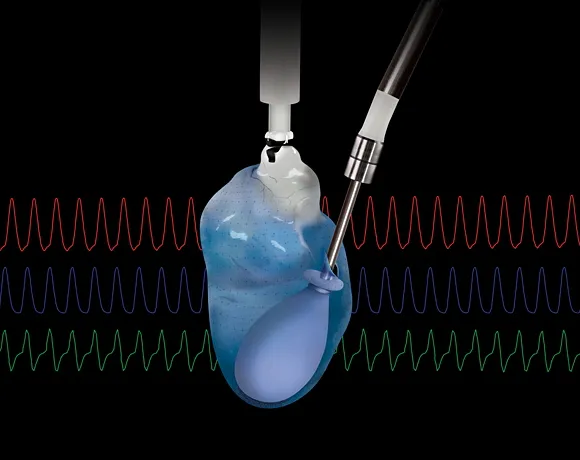
Cardiovascular Cardio Electrophysiology
ECG
Animal Autonomic
HRV
Animal Autonomic
Biopotentials
Animal Telemetry
Signals
Key Features
- Detection and analysis of R waves & RR interval variation in ECG in real-time or offline.
- HRF Software ideal for animal and human cardiovascular studies.
- Automatically classify beats as normal or ectopic from animal presets or user-selected interval classification limits.
- Exclude artifacts or include beats in the analysis on an individual basis.
- Adjustable histogram bin size.
- Automatic generation of clinically accepted statistical parameters.
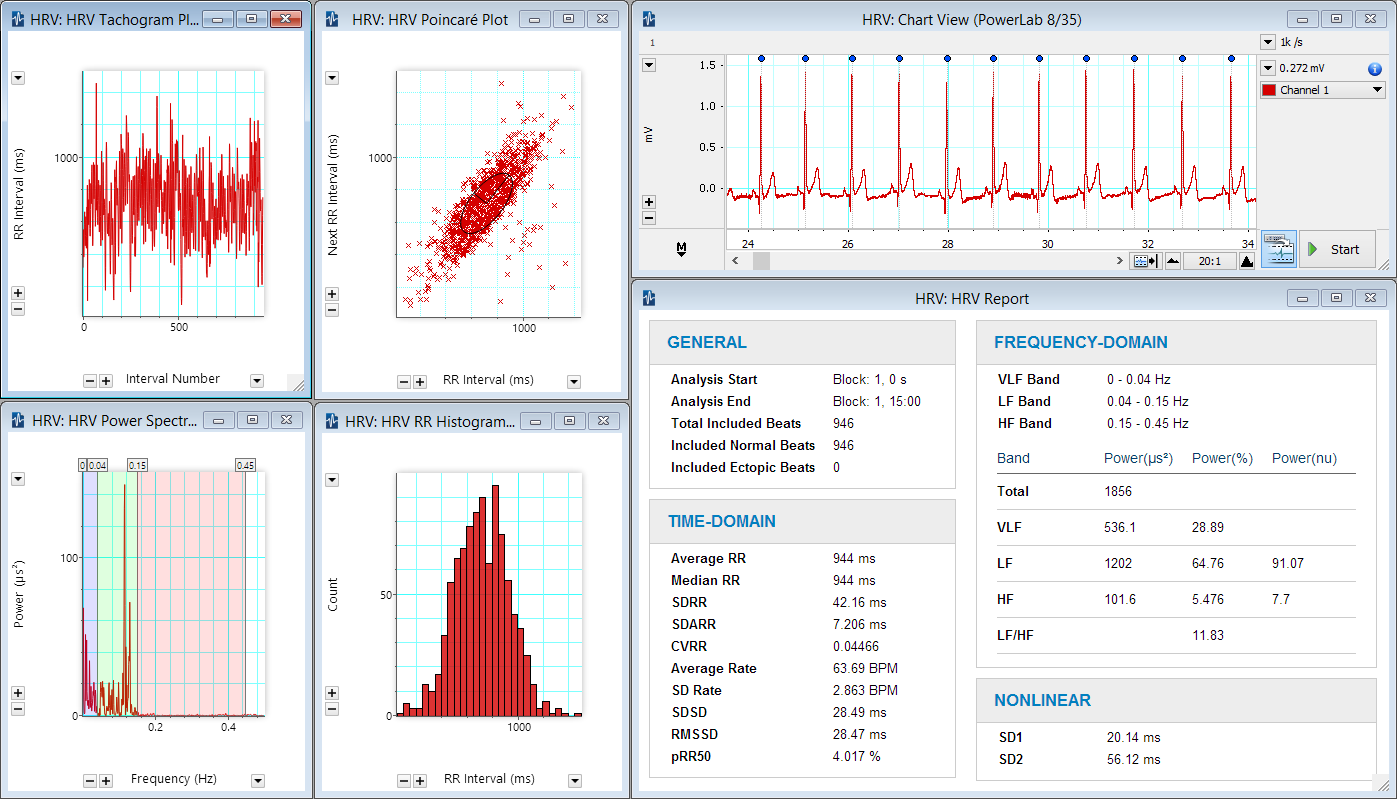
- Specialized HRV data analysis plot windows derived from RR interval data includes:
- Poincaré Plot: scatter plot where each RR interval is plotted against its preceding RR interval.
- Period Histogram: displays the frequency distribution of RR intervals.
- Delta RR Histogram: displays the frequency distribution of differences between each RR interval and its successor.
- Tachogram plots: successive RR interval values against the ‘beat number’.
- Spectrum: displays the power spectrum of time-based Tachogram, also referred to as the 'Spectrum of Intervals'. Draggable vertical lines indicate limits of LF and HF regions of the spectrum.
- Automatic generation of exportable and printable report displaying HRV analysis statistical results.
- All HRV windows are linked for immediate update when modifications are performed.
Support
Support Articles
Our Support Articles contain answers to common questions, how-tos, solutions, and documentation.
Training and Workshops
Maximize time and resources with our customized training services delivered at your facility, on your equipment, on your terms.
Details and Tech Specs
Technical
Compatibility
LabChart 8 for Windows | checkmark |
LabChart 8 for Mac | checkmark |

Using the HRV Add-On you can easily generate Tachogram, Poincaré, Power Spectrum and RR Histogram plots from an ECG. Delta RR Histogram plots are also available.
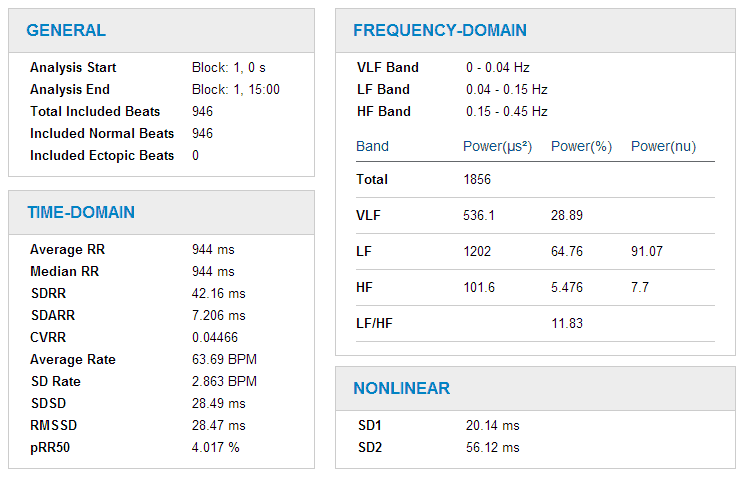
The Report highlights the nonlinear, time-domain, and frequency-domain results.