LabChart Lightning aims to provide increased flexibility over how users can organize and interact with their recorded data. In this video we will provide an introduction to signals and channels in LabChart Lightning.
Signals vs. Channels - What's the difference?
A LabChart Lightning recording contains one or more signals. Signals can be either “recorded” or “calculated”.
Recorded signals are a series of data points captured from your recording equipment and will form the backbone for nearly all visualization and analysis in the software. Calculated signals are typically derived from recorded signals and can be used to capture extra information from the signal.
A signal has associated properties such as hardware properties (when sampling the data), colour and units information that can be changed by clicking on the signal’s name.
In LabChart Lightning, a channel corresponds to a rectangular area in the application that can display signals. A channel may be empty or contain one or even multiple signals.
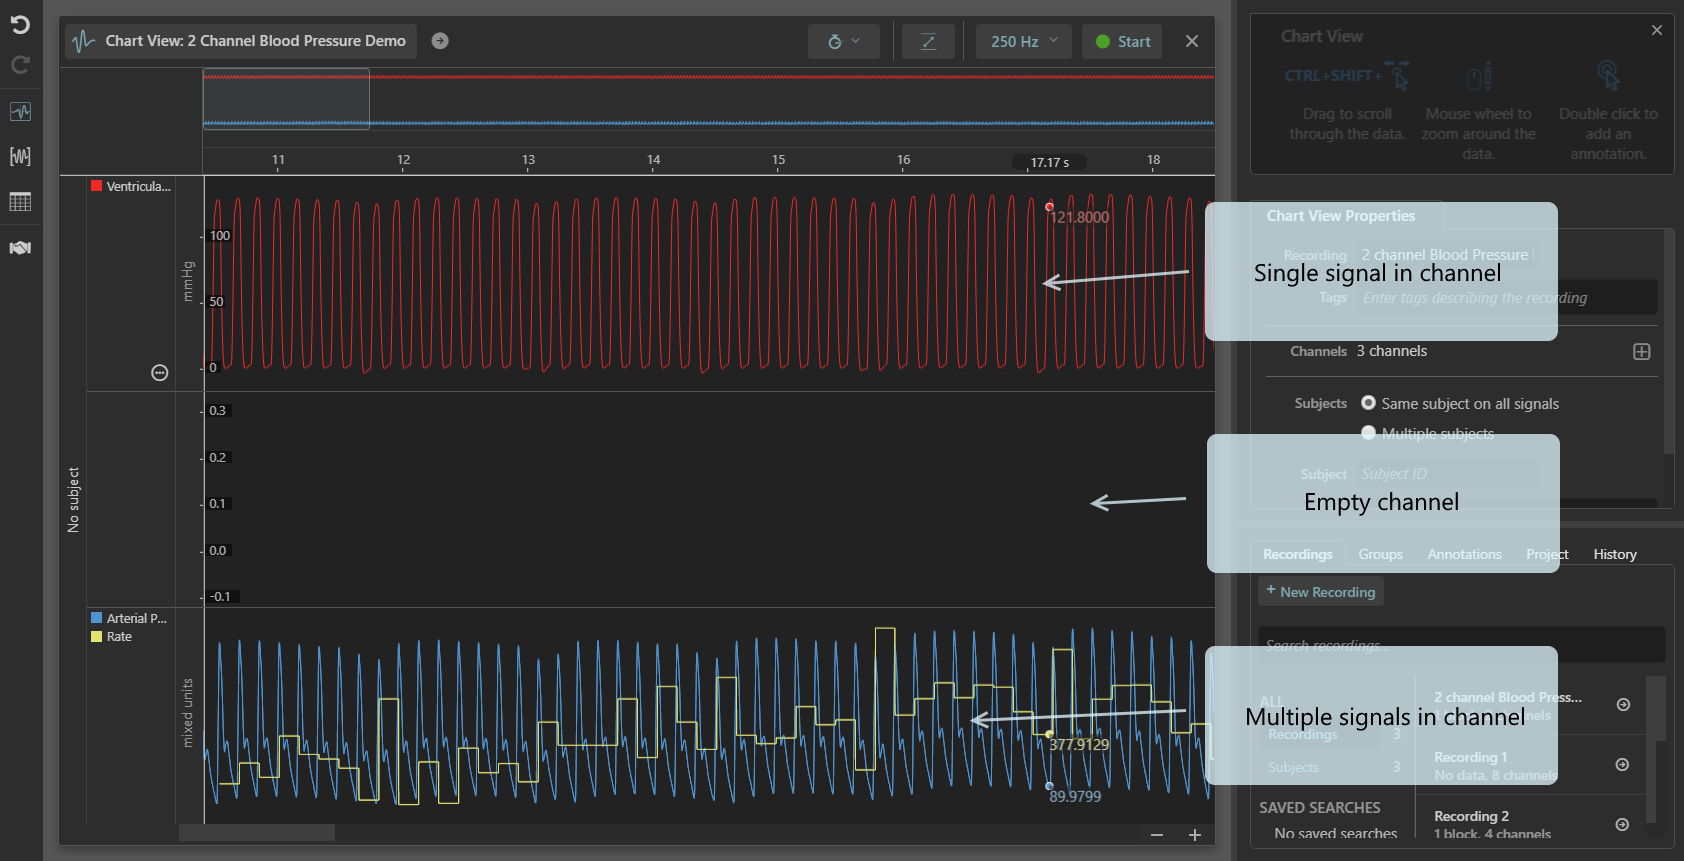
A signal can be displayed within any channel the user chooses.
Because the display of signals is purely visual, altering the mapping of signals to channels has no effect on any analysis that makes use of signal data. Furthermore, a signal can contribute to analysis even though it is not visible in the Chart view!
Learn more: Mapping Signals and Channels in LabChart Lightning »
If you have any questions not covered in this video or our other support material, please feel free to contact your nearest support representative - we’d be happy to help!
Enjoy!
The LabChart Team