
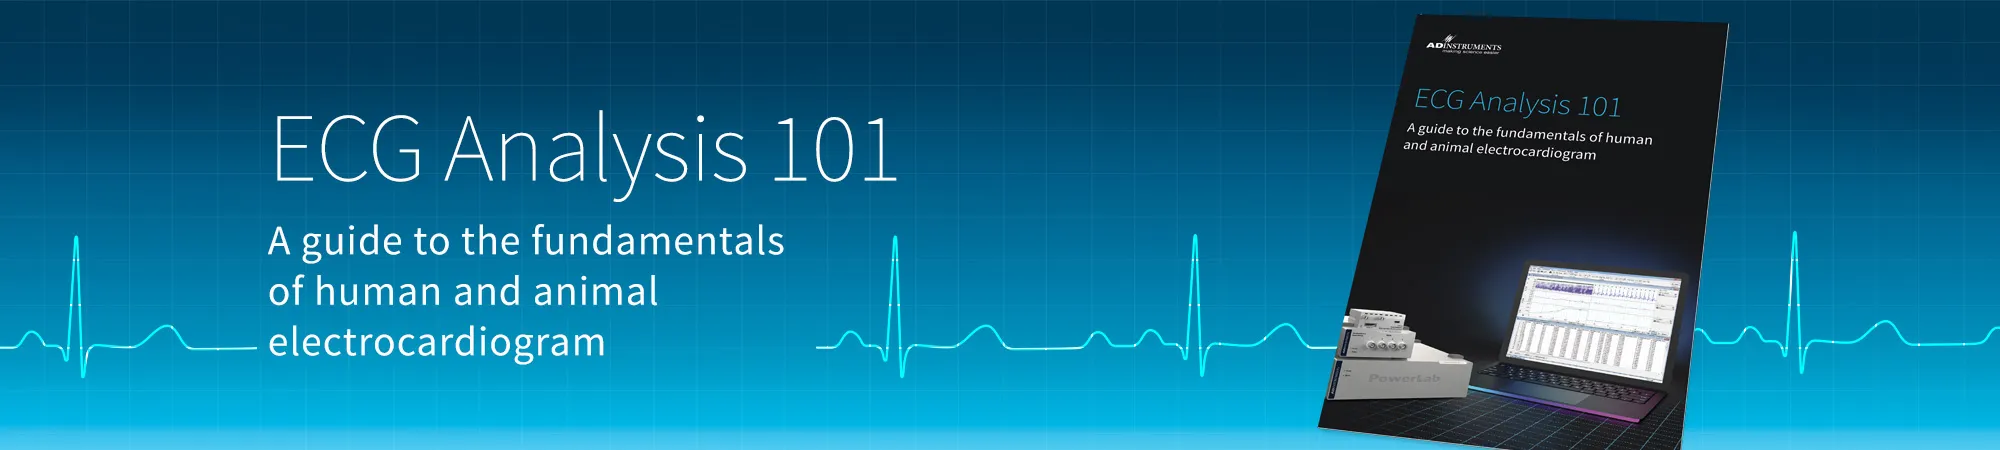

Make the most of your ECG recording with our new ECG Analysis Guide!
Learning how to reliably perform and analyze an ECG is a key physiological research skill, even if you don't use it all the time. As a non-invasive technique in human research, ECG makes a great addition to a wide range of research protocols, from cardiovascular assessments to exercise physiology to cognitive psychology.
In animal research, it can be either invasive or non-invasive, and can even be recorded via surgically implanted telemeters over weeks or months. ECG recordings provide a wide view of cardiac functioning, giving insights into the heart's electrical function, mass, contractility, health as a whole, and the health of the components of the heart. ECG can reveal stress-induced dysfunctions, irregularities, disease progression, and tone of the autonomic nervous system.
Making the most of this widely used, highly informative technique requires an understanding of not just how to set it up, but also understanding what the ECG is actually recording, and how best to analyze and interpret your results.
Download our ECG Analysis 101 Guide
This guide includes full explanations of:
- The PQRST waveform.
- The cardiac cycle that produces the waveform.
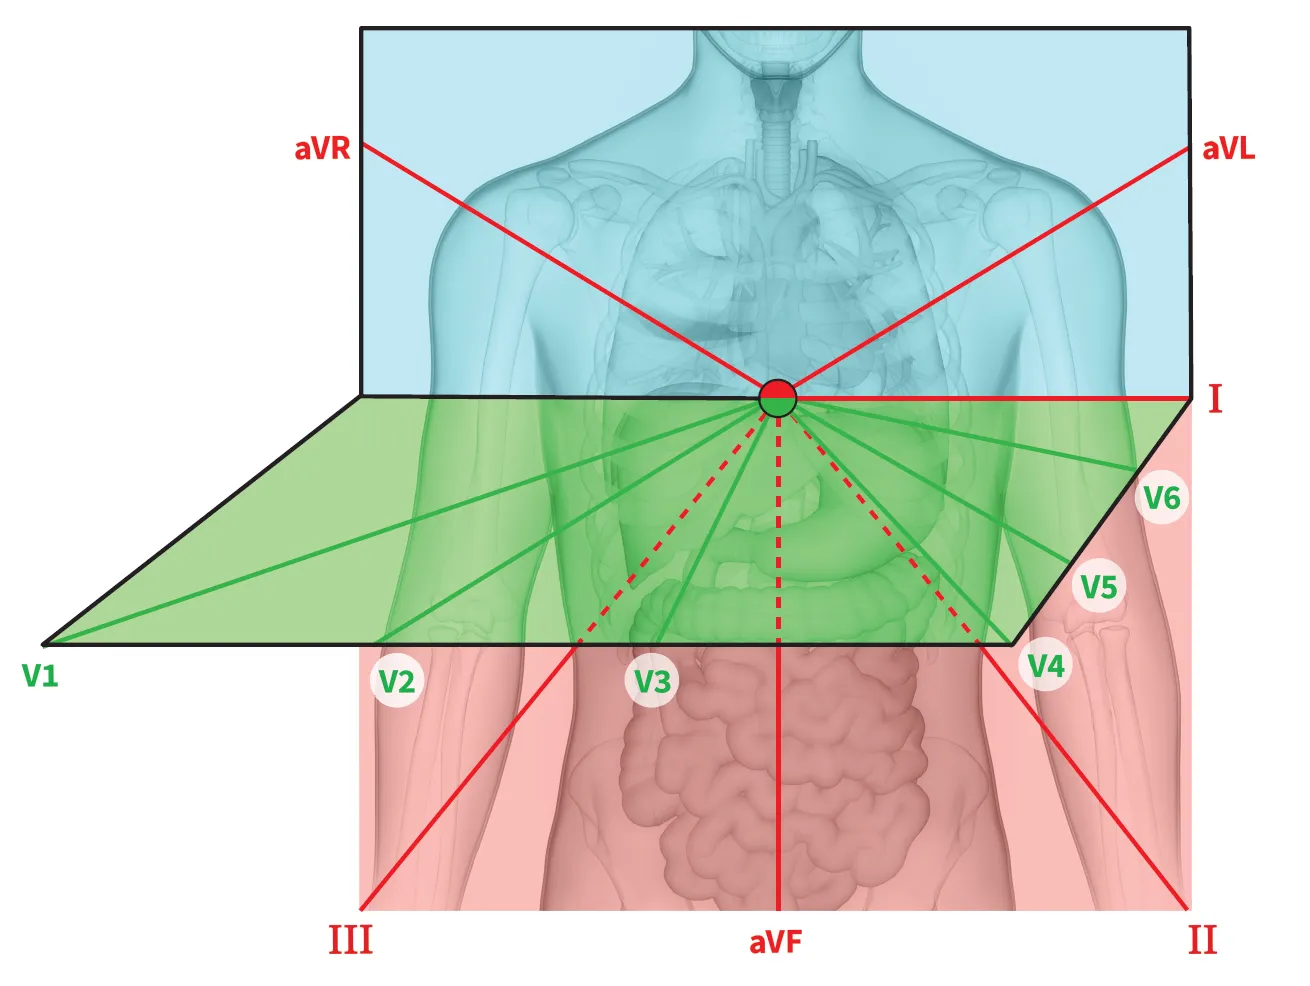
- ECG leads and the Einthoven's Triangle.
- Conduction Axis.
- The importance of accurate lead placement.
- The core steps of human ECG analysis.
- Expected variations in animal ECG, including example animal ECG traces.
Related: 12-Lead ECG Placement Guide >>
ECG analysis is simplified by employing the LabChart ECG Analysis Module, which facilitates easy measurement, built-in calculations, and automatic adjustments based on the species of your subject.
Get the most out of your cardiovascular data by combining the ECG Analysis Module with additional LabChart Modules such as:
Cardiac Axis - a heart axis calculator add-on for LabChart that automates calculation of frontal plane electrocardiograms and animates cardiac vector display.
HRV - the R-wave threshold detector identifies and calculates ECG beat-to-beat interval variation to automatically categorize beats as normal, ectopic, or artifact (can also be used with arterial pulse signal).
PV Loop - specifically designed for the analysis of in vivo ventricular pressure-volume data in small and large animals, or ex vivo, using working heart systems.
Peak Analysis - provides automatic detection and analysis of multiple, non-overlapping signal peaks.
Download our ECG Analysis 101 Guide