Peak Analysis
The Peak Analysis Module for LabChart provides automatic detection and analysis of multiple, non-overlapping, signal peaks.
Download SoftwareOverview
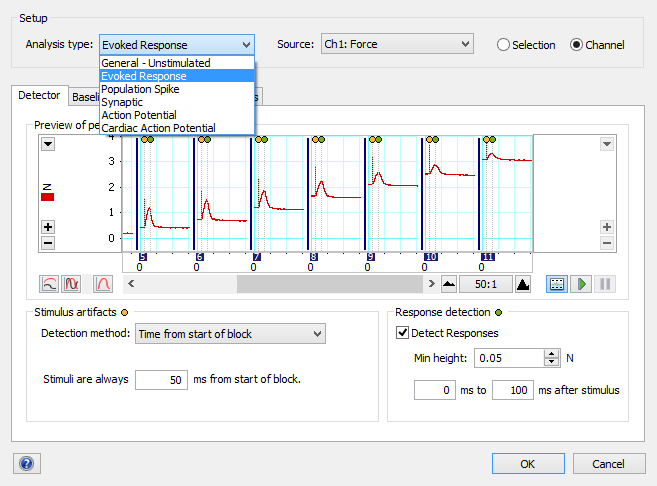
The Peak Analysis Module for LabChart provides automatic detection and analysis of multiple, non-overlapping, signal peaks in acquired waveforms. The module can be used either offline, to analyze peaks in existing recordings, or online, to analyze peaks as they are being recorded. Users can select from one of several analysis settings available for general waveforms and specific signal types.
The Peak Analysis Module is included as part of LabChart Pro or can be purchased separately.
Related
Research Applications
Human Psychophysiology
Respiratory Belts
Human Respiratory
Respiratory Pressure
Human Respiratory
Langendorff
Cardiovascular Isolated Heart Systems
In Vitro Pharmacology + Isolated Tissue and Organs
Working Heart
Cardiovascular Isolated Heart Systems
In Vitro Pharmacology + Isolated Tissue and Organs
Biopotentials
Human Sleep Studies
Respiratory
Human Sleep Studies
Microneurography
Human Autonomic
Pulse and Plethysmography
Human Tissue and Circulation
Small Animal Telemetry
Animal Telemetry
Pulse and Plethysmography
Animal Tissue and Circulation
Evoked Responses and Stimulation
Animal Neuroscience
Isolated Tissue Baths
In Vitro Pharmacology + Isolated Tissue and Organs
Isolated Organ
In Vitro Pharmacology + Isolated Tissue and Organs
Tubing Flow
In Vitro Pharmacology + Isolated Tissue and Organs
Video Capture
Animal Neuroscience
Nerve Recording
Animal Autonomic
Surface ECG
Cardiovascular Cardio Electrophysiology
ECG
Animal Autonomic
HRV
Animal Autonomic
Tissue Oxygen
Animal Tissue and Circulation
Biopotentials
Animal Telemetry
Optogenetics
Animal Telemetry
Tissue Oxygen
Animal Telemetry
Key Features
- Suitable for a wide range of signals.
- Calculates and reports a wide range of peak parameters.
- Graphical display of calculated parameters as continuous signals in LabChart channels in real time.
- Detects positive or negative peaks.
- Analysis presets suitable for general and specific types of waveforms includes:
- General Unstimulated – for peaks in waveforms without stimuli
- Evoked Responses – for monophasic peaks that follow a stimulus
- Population Spikes – for extracellular evoked responses
- Synaptic – for synaptic measurements
- Action Potentials – for intracellular neuronal action potentials
- Cardiac Action Potentials – for monophasic intracellular and extracellular cardiac action potentials
- Peak Analysis Settings Dialog allows the user to modify settings including:
- Detection: Determines how stimulus artifacts and peaks are detected
- Calculations: Set boundaries for the calculation of peak parameters
- Table Options: Custom selection of calculated parameters to be displayed in the Table View
- Peak Analysis Table View displays calculated parameters for all detected peaks:
- Export tab: Automatically saves Table View contents as text file that can be opened in other applications
- Settings tab: Allows selection of parameters to be displayed
- Add to Data Pad tab: copies values to LabChart’s Data Pad to allow exporting and OLE linking to other applications such as Microsoft Excel
Support
Support Articles
Our Support Articles contain answers to common questions, how-tos, solutions, and documentation.
Training and Workshops
Maximize time and resources with our customized training services delivered at your facility, on your equipment, on your terms.
Details and Tech Specs
Technical
Compatibility
LabChart 8 for Windows | checkmark |
LabChart 8 for Mac | - |


