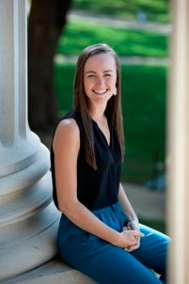
Claire Trotter.
Southern Methodist University
Claire Trotter is a researcher in the Integrative Physiology Laboratory at Southern Methodist University in Texas.
Claire was part of our Early Adopter group who trialed LabChart Lightning, using it for quantitative data analysis in her lab.
She shares her experience with us, in particular around LabChart Lightning's compatibility with Mac, its easy-to-use interface, and the ability to overlay multiple signals for easy and accurate real-time data comparison.
LabChart Lightning is ADI's new DAQ software. It forms a pivotal part of our full data acquisition and analysis offering, which is specifically designed for quantitative data analysis in scientific research applications.
An Innovative Early Adopter
As part of the Early Adopters group Claire was invaluable as a "test driver" of our new LabChart Lightning software, focussing on its capabilities on the Macintosh platform.
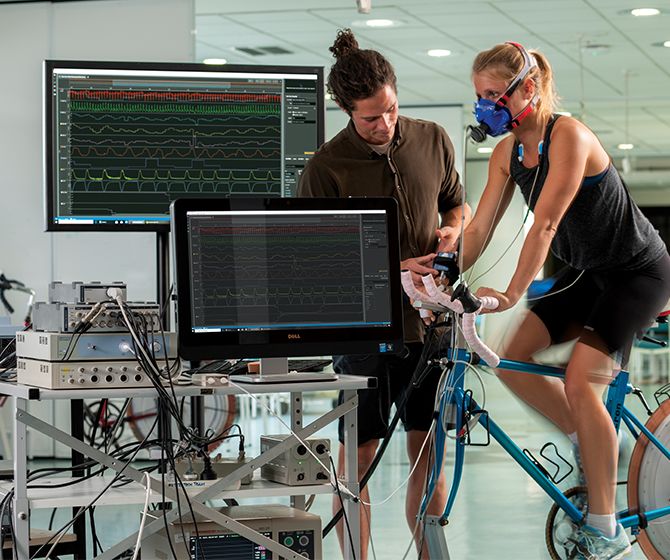
Claire's research interests consist of autonomic nervous system function in health and disease. Claire says, "We are interested in real-time responses to interventions that alter central nervous system function, such as high ambient temperatures, exercise, painful stimuli, and lower body negative pressure. Currently, PowerLab, and LabChart allow us to effectively monitor real-time physiological data, a crucial capability to safely implementing our protocols in a patient population. The addition of LabChart Lightning allows for seamless and accurate data analysis."
Related: How Lightning helps physiologist Keith Siew save time and streamline his analyses
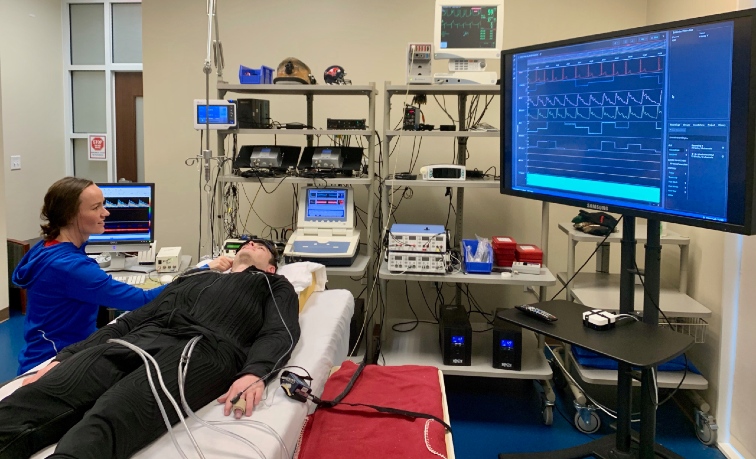
Claire Trotter using LabChart Lightning in the Integrated Physiology Lab at Southern Methodist University.
Using LabChart Lightning in the Integrated Physiology Lab
As part of LabChart Lightning's Early Adopters group, Claire used the new software multiple times to acquire data. Here is her review of a few of LabChart Lightning's new features:
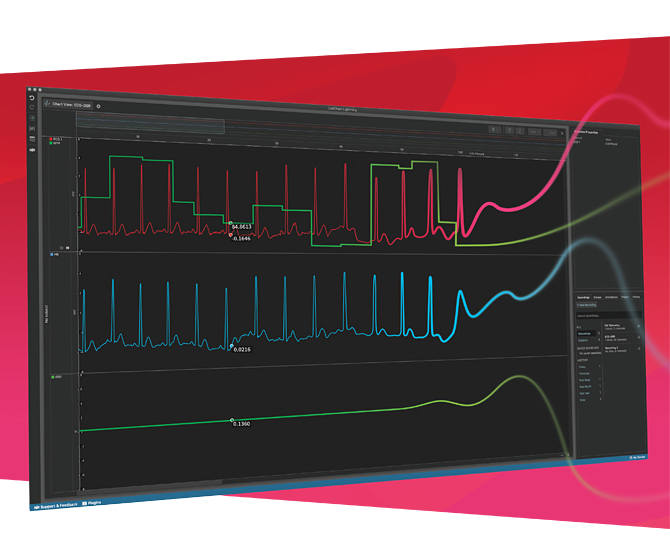
#1: The ability to overlay multiple channels
Claire says: "Users can overlay multiple signals on top of one another in a single channel which allows for easy and accurate comparisons during data collection. Often our trials can last up to 3 hours or longer, so it is helpful to be able to easily gain insight into what is happening in the current moment. Also, in my opinion, this feature improves the ability to detect if a signal is not being collected properly."
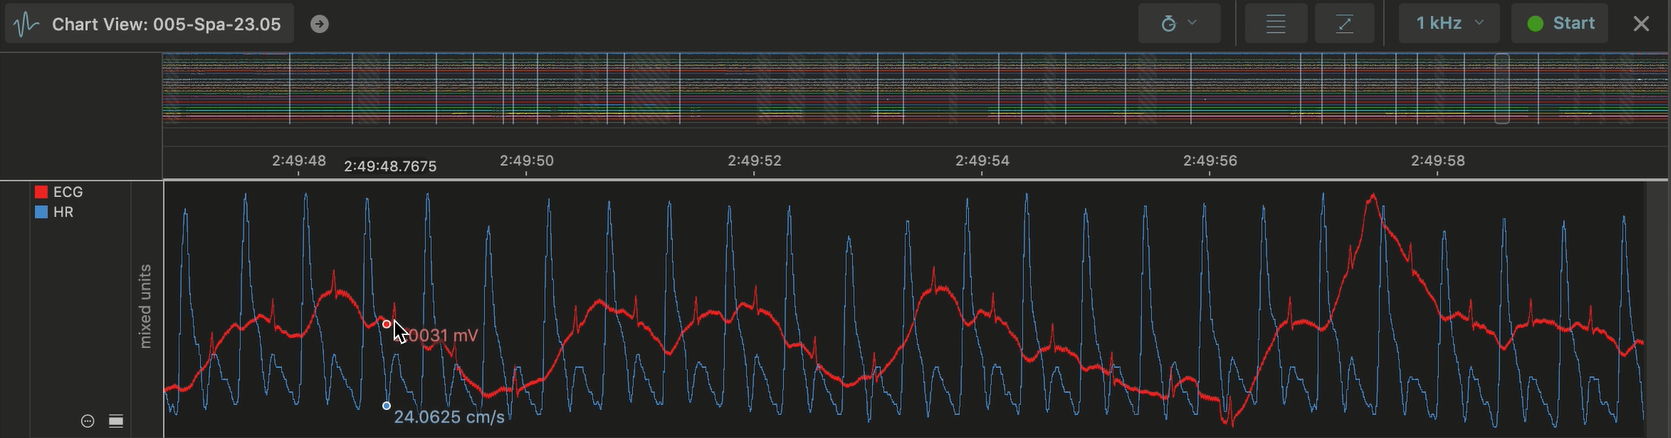
Improved features: Multi Channel Overlay and Dark Mode in LabChart Lightning.
#2: User-friendly interface - Dark Mode!
"The greatest feature of Lightning is the user-friendly interface. With the ability to switch to Dark Mode, you are easily able to see and identify data from a distance because of the increased contrast. The scrolling features have also been improved to allow you to see a snapshot of all the data and to click on exactly the time point of interest."
#3: Mac compatible
"Lightning is a vast improvement from LabChart 8 and LabChart 7 on the Macintosh operating systems. Lightning allows for uninterrupted Apple AirPlay streaming to large monitors so it can be viewed by multiple individuals in the laboratory and functions correctly on Macintosh computers with Retina displays."
#4: The ability to have multiple recordings in one project
"Lightning's project structure allows you to easily manage all your data in one location. Often our lab creates multiple files during a study visit. Project structure now allows us to easily navigate all of the recorded data."
What would you like to see added to LabChart Lightning next?
"Data sharing capabilities. Easy file sharing and converting capabilities are crucial for collaborating labs. File sharing could also be greatly enhanced if you were able to stream real-time data collection on multiple computers via an internet platform. For example, if multiple labs are collaborating on a project it would be great if another lab could log into a secure platform and stream and store what is being collected in real-time."
Related: Try LabChart Lightning on a 30 day free trial
ADInstruments would like to thank Claire Trotter and all of the participants in the LabChart Lightning Early Adopters program for their generosity of time, knowledge, and invaluable feedback in creating this innovative new data acquisition software which will take researchers and their work into the future.
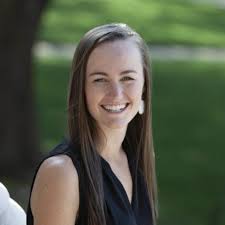
Claire Trotter is a Ph.D. Fellow in the Department of Applied Physiology and Wellness at Southern Methodist University in Texas. She is a 2020 recipient of a National ACSM Doctoral Research Grant from the American College of Sports Medicine Foundation, which will help fund her research investigating central nervous system dysfunction in multiple sclerosis patients.
For more information about Claire's research, check out her most recent publications, or you can follow her on Twitter where she regularly posts about her work.
Find out more about LabChart Lightning