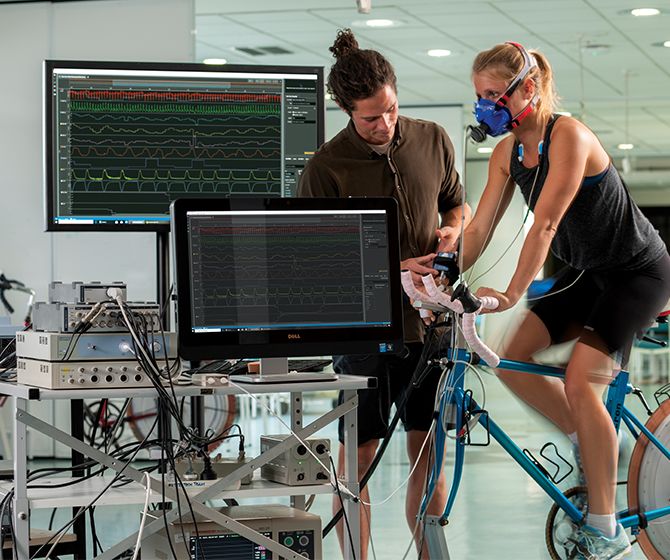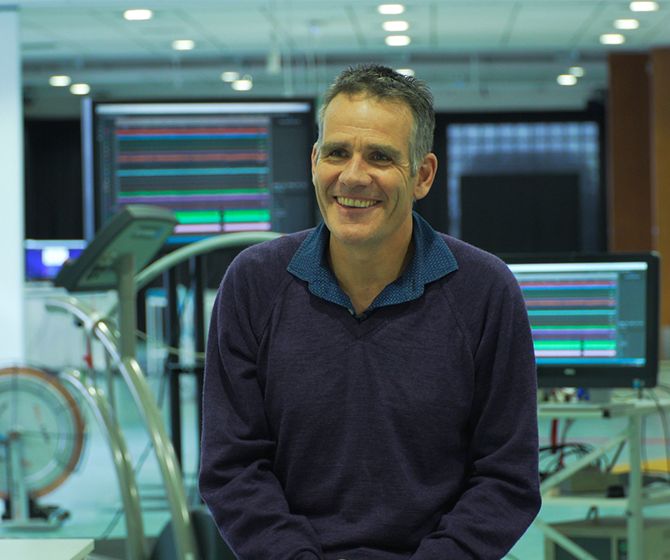
Keith Siew (Ph.D.) is a renal-cardiovascular physiologist at UCL Medical School, with primary research focus on understanding how the kidneys function and control blood pressure.
Since 2011, Keith has been using various iterations of LabChart for sampling and analyzing his data. While he loves the software and has published numerous papers using LabChart Pro, he still finds inefficiencies when it comes to visualizing and analyzing all his data post-acquisition.
As part of our Early Adopters group, Keith has been trailing our innovative new DAQ and analysis platform LabChart Lighting. Lightning has provided a means for Keith to streamline his processes and save valuable time during his analyses. Below he explains how...
#1: Lightning enables you to visualize your data in a cohesive way
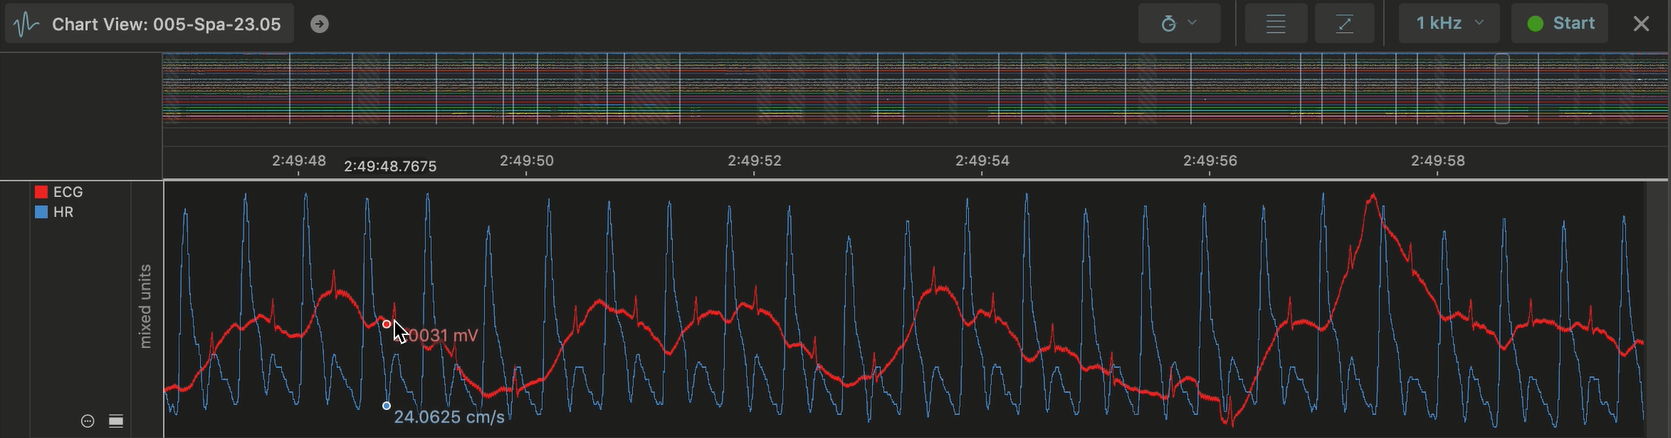
"With Lightning, it's just more intuitive. Even though I haven't had the chance to use all the new features yet, I can immediately see how they would change my experiments. For example, being able to overlay my systolic, diastolic and raw blood pressure trace in the same channel would be really handy. It makes it easy to see if anything strange is happening with the data."
"Another new layout feature that I really like is the compressed view of your data across the top of the screen. You can easily see where you are in your data and quickly navigate to areas of interest. Before, I was having to constantly zoom in and out in order to do quick quality checks. So being able to quickly navigate through my data using the compressed view at the top has saved me a lot of time."
#2: Lightning saves you time during analysis
"Another feature that caught my attention was the cross-recording analysis. For me, I was always quite happy with how I was capturing data, but the analysis afterward ended up being my bottleneck."
"With LabChart 8 I was constantly having to jump between different files. Our group often explored the possibilities of genes dose (i.e. wildtype vs. heterozygote vs. homozygote) and sex effects, and comparing between these was clumsy and time consuming. Often I would have to have three computers open, each with their own copy of LabChart installed just to try and compare all the different files."
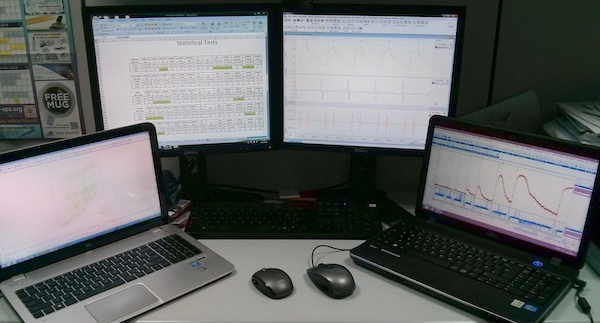
A typical setup for Keith when analyzing his data in LabChart 8.
"The fact that you can now group data files within projects is really handy. Having the ability to open up multiple files, pair them to each other and overlay certain signals is extremely useful. It's a lot easier to compare data across different experiments - saving me space on my computer as well as time."
Find out more about projects and recordings in LabChart Lightning »
#3: Lightning helps to document workflows and streamline your analyses
"One feature I quite like is the way I can label and annotate my data. I find it so much better compared to LabChart 8."
"I essentially use my recording as my lab book - labelling the different events as they take place e.g. inducting the animal, making the incision, acclimatization and so on. So for me, it's very handy when analyzing my data to be able to go back to these tagged regions simply by searching for the tag - rather than having to scroll back looking for a specific timestamp like you had to in LabChart 8."
#4: Lightning lets you analyze your data anytime, anywhere
"A big thing for me is actually the licensing. While I appreciate all the new functionalities in Lightning, the new licensing model has actually helped the most. In our lab, we only had two LabChart licenses - one on my laptop and another on a laptop in the lab."
"With Lightning, there’s now the option to anchor the license to a computer, or to an individual. The fact that you can anchor it to a computer is quite useful as you don't need to be connected to the internet to log in. Plus, if I need my colleagues or collaborators to look over some data or perform additional analyses, I don't need to buy them a brand new license, I can just get them to log in to the computer or administer them an individual license that’s not being used. That kind of flexibility is something that I particularly like."
Related: Try LabChart Lightning on a 30 day free trial
ADInstruments would like to thank Keith Siew and all of the participants in the LabChart Lightning Early Adopters program for their generosity of time, knowledge, and invaluable feedback in creating this innovative new data acquisition software which will take researchers and their work into the future!
Keith Siew (Ph.D.) is a Sir Henry Wellcome Postdoctoral Fellow in the Department of Renal Medicine at University College London, and the Scientific Editor for The Physiological Society’s quarterly Physiology News Magazine.
His research focuses on rare diseases that affect blood pressure through alterations in electrolyte handling by the kidney. For more information about Keith’s research, check out his most recent publications, or you can follow him on Twitter where he posts regular updates about his studies!
Find out more about LabChart Lightning