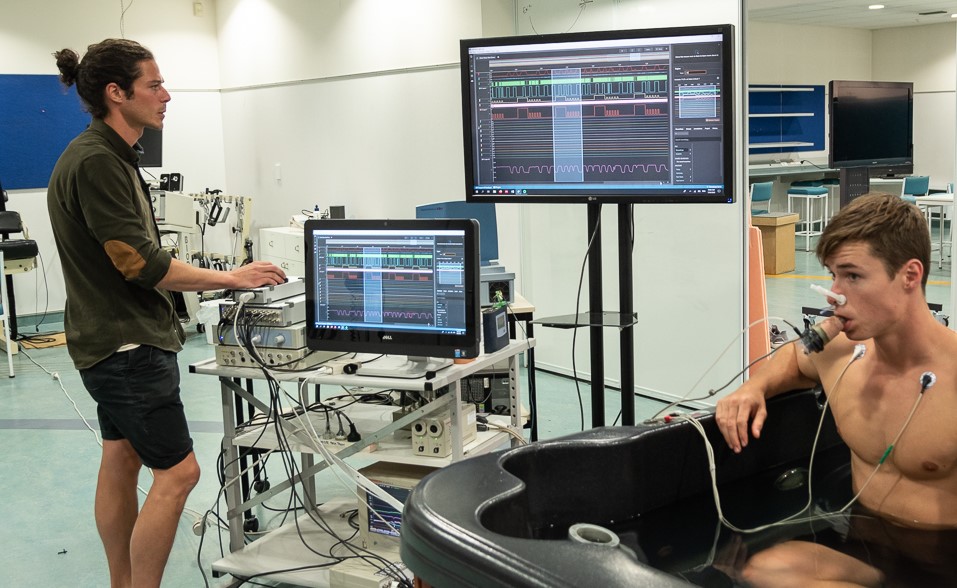
Meet Travis Gibbons, Ph.D. student at the University of Otago, School of Physical Education of Sports and Exercise Science.
Since joining Jim Cotter’s Lab in 2017, Travis' research has taken him around the globe from Kelowna, Canada, to 4300 m above sea level to the city of Cerro de Pasco, Peru, studying how environmental stressors such as high altitude, heat, and cold stress affect the physiology of the body.
Up until recently, Travis has been using LabChart 8 for all of his data collection and basic analysis, however, for his more recent experiments, he has been trialing LabChart Lightning - our new interactive data acquisition and analysis software.
Hear about his experience using LabChart Lightning below!
LabChart Lightning is our latest iteration of LabChart, and includes a range of new features such as unlimited channels, custom calculations, and cross recording analysis - all of which have given Travis the freedom and flexibility to record and analyze his data the way he wants to.
Unlimited customized channels
In any one experiment, Travis might need to collect 15-20 raw signals from his subject, plus a variety of derived (or calculated) signals on top of that. When using older versions of LabChart, Travis found that he was often limited by the number of channels he could record data into, and unable to display all his channels in a simple, cohesive way.
‘I find that LabChart Lightning gives you the freedom to customize your signals the way you want to, as opposed to fitting the more ‘cookie-cutter’ mold of LabChart 8.’
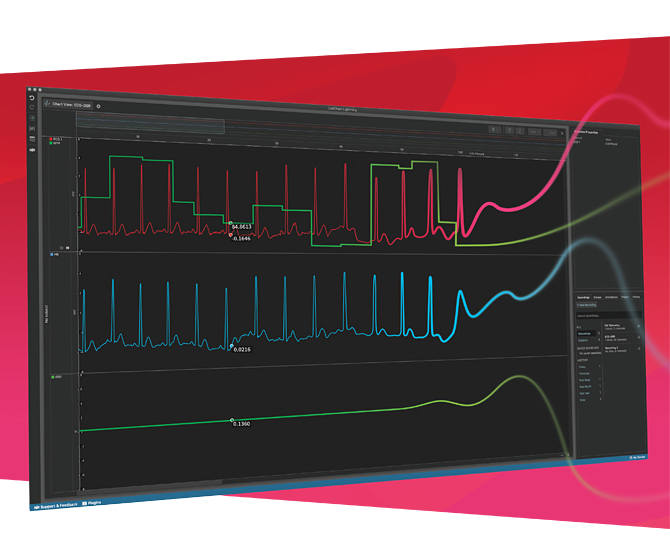
With LabChart Lightning, you’re no longer limited by the number of channels you can have in your project file, and you can easily overlay signals from different channels overtop of one another. Travis has found these new features to be particularly helpful when displaying derived variables such as diastolic and systolic pressure, over the raw blood pressure trace.
'The nice thing about LabChart Lightning is you can overlay derived signals over top of the raw variables. This means you can collect a lot of data in real-time, without clogging up the screen, and appraise the signals as you’re collecting them.'
Easily create custom calculations
As mentioned above, Travis measures a range of raw physiological signals straight from the participant and calculates derived variables, such as diastolic and systolic pressures from these.
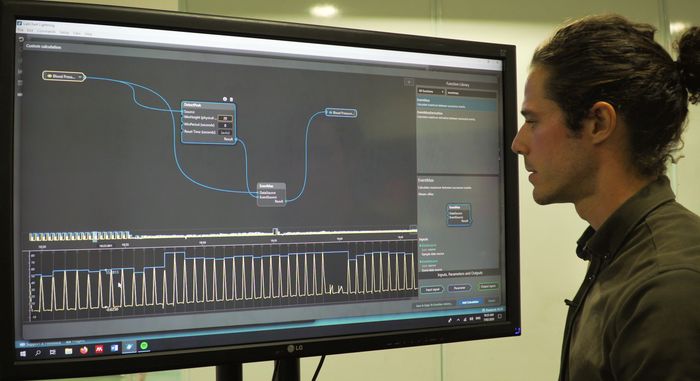
In LabChart Lightning, we have designed a new custom calculations tool where you can simply drag and drop functions from our extensive library to create both simple and complex calculations.
‘I’ve mainly used the custom calculations feature for creating custom channels - such as pulling the systolic and diastolic peaks off my raw blood pressure recording and overlaying these signals within a single channel.’
‘For someone who is not good at coding, or even software in general, it's been really helpful. It's very intuitive - just copy, paste, and drag.’
Readouts on critical variables in real-time
Travis explains that during their thermal tolerance experiments, to ensure the safety of the participant they need to have a reliable readout on important variables such as core temperature. ‘When we are heating people to their thermal tolerance, we need a reliable measure of core temperature - If our participants go above 40 C, they are in danger of passing out.’
With LabChart Lightning, Travis found that he could easily keep a close eye on participant safety by using the large readout panel to quickly see any changes in key variables such as core temperature.
Project-based data storage and cross-recording analysis
The majority of Travis’ studies involve repeat experiments on the same participant, over multiple days. When using older versions of LabChart, each of these experimental sessions would have to be stored in a separate file, making analysis between experiments and subjects difficult.
With LabChart Lightning, researchers can now save their data recordings as projects. This means you can have multiple recordings from different participants and experimental sessions open in one project file, making cross-recording analysis that much simpler.
'The ability to save multiple subjects and recordings under one project makes it easier to analyze important regions across multiple participants.'
Find out more about LabChart Lightning's new data management features »
Create tagged regions across multiple subject recordings
In LabChart Lightning, you can create regions or searchable areas of interest for batch analysis across multiple recordings. ‘I find I’m always looking for the same ‘thing’ within each recording, so to be able to tag these important regions across multiple recordings is extremely handy in cutting down my time spent on analysis.’
Travis also comments on how this feature would be useful for coordinating the intangible aspects of his experiments with the physical data they are recording.
‘Being able to coordinate a conversation I’ve had with a participant e.g. how the participant is feeling, to a specific region of physiological data, and have that constant across all my subjects within a project would be extremely valuable.’
Cross-platform - Available on Mac and Windows
As a field researcher, Travis is often moving around and having to make do with whatever computer is on hand at each location - whether that be a Mac or PC.
‘The fact that lightning works on both Mac and Windows is great, as I can easily switch back and forth between the two platforms without worrying about losing my data.’
Analyze data using dark view
Now in the final year of his Ph.D., Travis spends the majority of his time on the computer, combing through and interpreting his data. He’s found the option to switch LabChart Lightning to dark view particularly helpful on days where he’s spending long periods of time in front of a screen.
‘For researchers like myself, we might spend 10% of the day collecting the data and 90% of our time analyzing it. So anything that makes it easier to look at over long periods of time, like dark mode, goes a long way.’
Find out more about LabChart Lightning