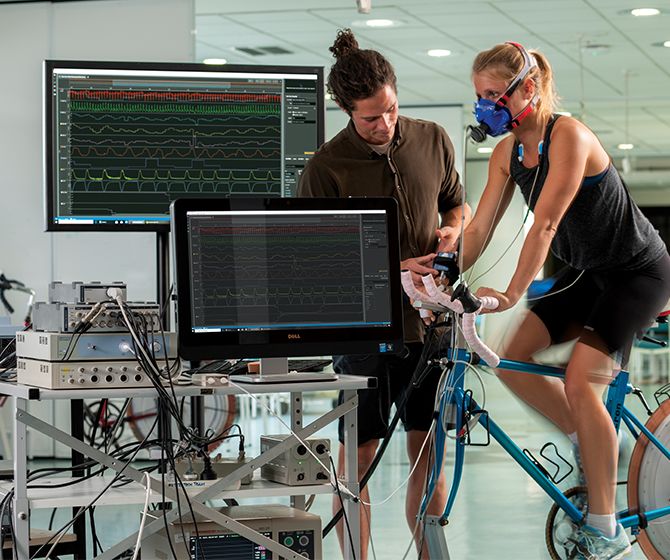
Jim Cotter, Exercise and Environmental Physiologist from the University of Otago has been using ADInstruments’ equipment for over 25 years.
During this time he has seen the rapid development of the initial data acquisition and analysis software Chart, into LabChart, and now finally into its most recent iteration, LabChart Lightning.
As a longtime user of ADInstruments software, Jim was approached early last year to be part of our Early Adopter’s program for LabChart Lightning. As an Early Adopter, Jim got the chance to trial the software during its development and give feedback on the features he liked/disliked, plus any additional features he thought were important to include from a research standpoint.
Although Jim tells us he isn’t the primary user of the new software platform, after trialing Lightning for the last year, he and his group can already see the benefits it will provide for them - from saving time during analysis to improving their data integrity and data management.
Modern, intuitive user interface
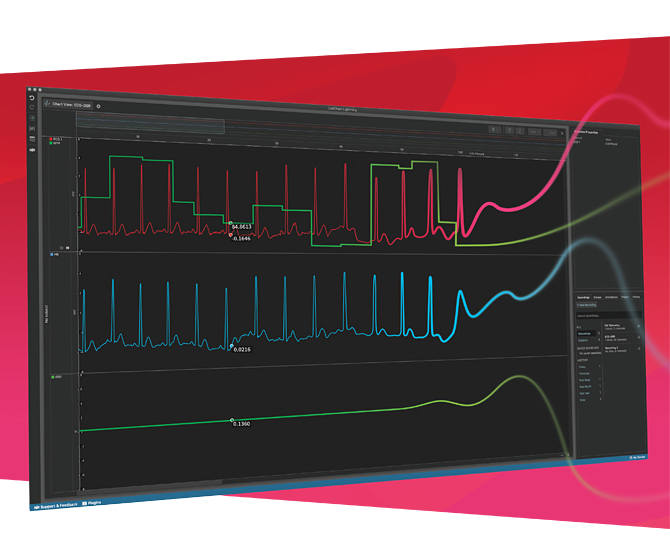
The first thing Jim noticed about LabChart Lightning was the more engaging user interface (UI). The ability to drag and drop signals over one another and easily navigate through large data files were two standout features for the long-time LabChart user.
‘For our new students coming in, Lightning will be fantastic, because it's more intuitive. The new drag and drop feature for organizing your channels is the type of interface they're used to using.’
‘Plus, I love how you can immediately see where you are in the data files. The fact that you can so easily navigate back to find relevant sections, such as a participant's baseline status, is gold.’
Unlimited channels and overlaying of signals
Jim explains that in any one experiment the team regularly collects up to 20 channels of ‘raw’ signals (measured directly from the subject), plus any derived channels they require on top of that. This meant that when using older versions of LabChart, they were easily pushing the 32 channel limit.
With LabChart Lightning, you can have an unlimited amount of channels within your project, plus you can overlay derived channels on top of the raw signals, allowing you to visualize and keep track of your data in a more cohesive way.
‘Because we do such integrated studies, we need to be able to record and keep an eye on multiple variables simultaneously - so for an integrative physiologist, having unlimited channels and easy reorganization is fantastic.’
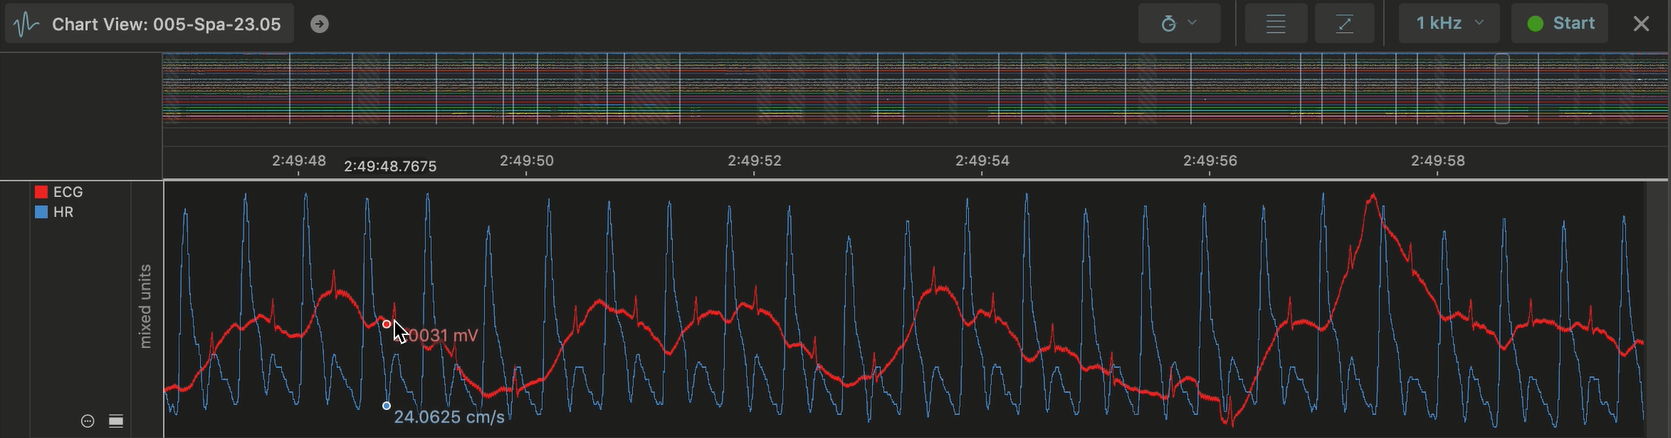
Also, Jim finds ‘The ability to overlay signals so you can see derived channels and keep an eye on critical signals is really valuable.’
Project-based data storage
Compared to LabChart 8, Lightning provides a new, streamlined, and logical way of storing and saving your data. Recordings can now be saved as projects, and users can assign subject and group information across a project file.
For Jim, the ability to group data from repeated experiments, across multiple subjects is extremely valuable and time-saving for him and his group.
‘Virtually all of our studies involve repeat testing on the same individual, so we need to know if the data we are seeing on the screen is ‘normal’ for that particular person. Having that information from previous experiments embedded within a project is extremely valuable.’
Find out more about LabChart Lightning's new data management features »
Third-party device connection
Jim explains that within both his teaching and research labs, they still regularly use a lot of existing equipment from other companies. However, successfully integrating the data from these various devices can be problematic, and quite frankly, frustrating.
LabChart Lightning has been designed in such a way that signals recorded through non-ADI devices can be integrated into the software platform, independent of a PowerLab data acquisition system.
‘The majority of labs around the world already have existing hardware that traditionally aren’t compatible. The fact that Lightning will provide the option for researchers and teachers to integrate their existing hardware into one platform is fantastic.’
Find out more about LabChart Lightning