The Graph Question panel gives students the ability to create and edit graphs. Students can select the data, graph type, curve fit, and label axes for the graph. A model answer can be set by the author, and the student's graph can be graded in the Grading Interface.
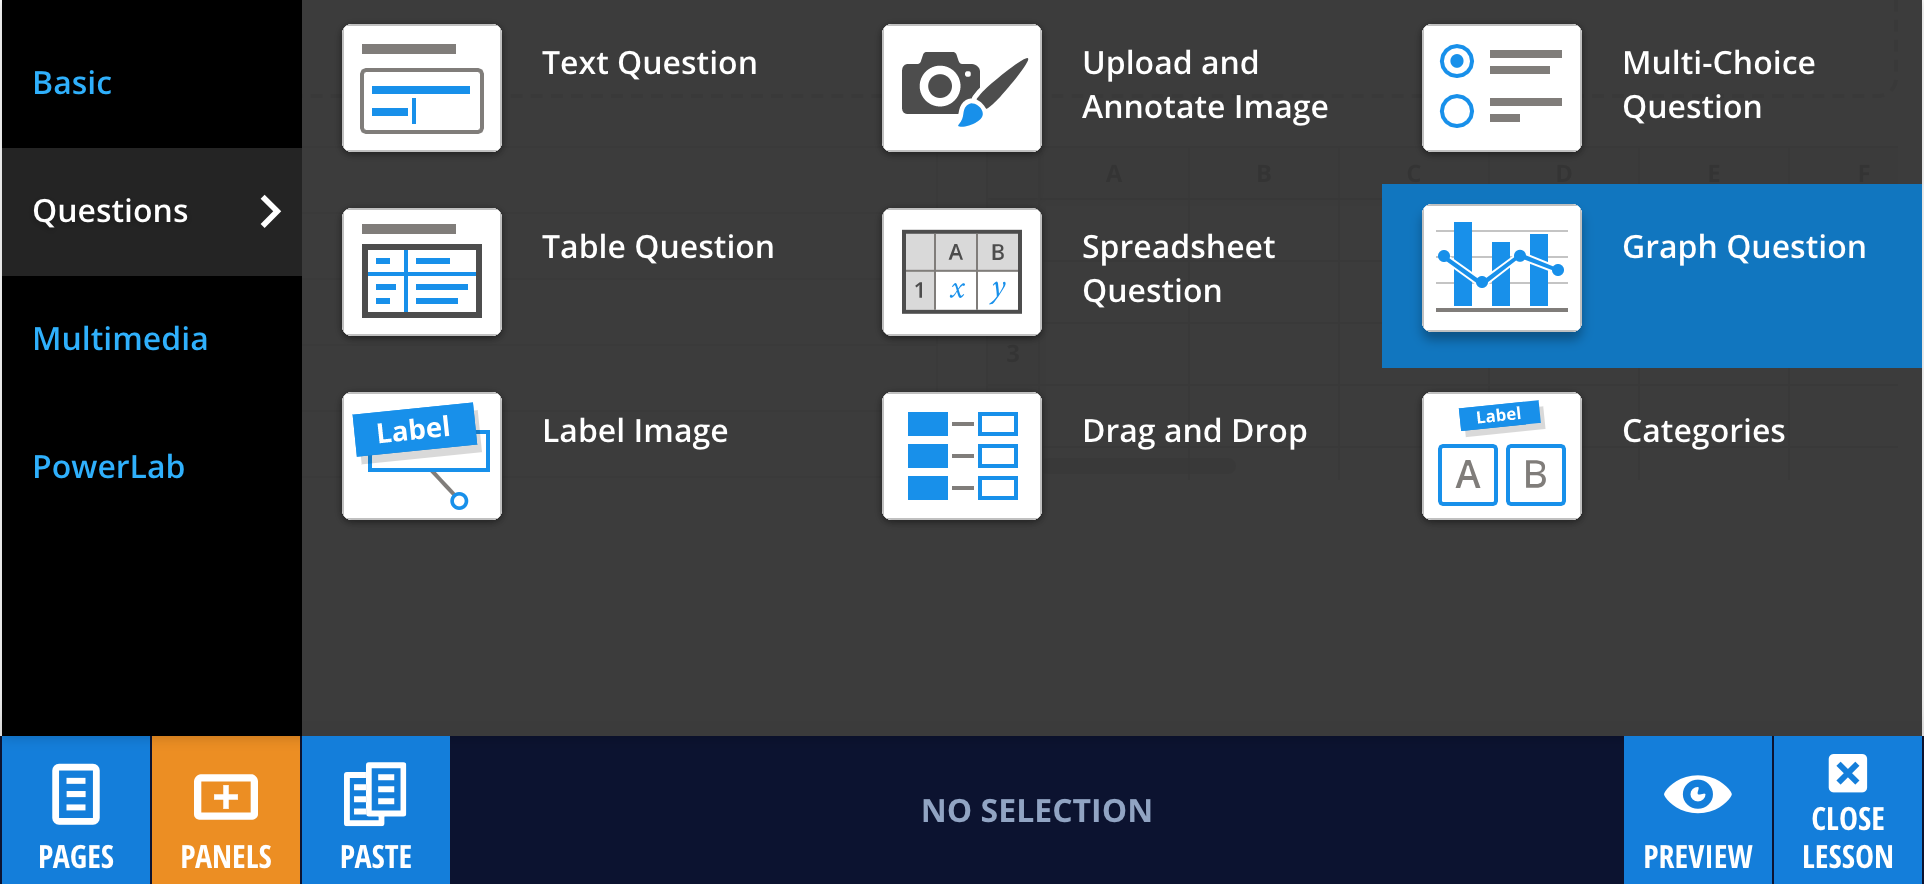
To add a Graph Question panel, select PANELS from the footer, then Questions from the PANELS menu as shown below:

Connect the panel to a Table or Spreadsheet panel the same way you would a normal Graph panel.
Note: Graph Question panels can also be connected to Table Question or Spreadsheet Question panels.
Editing your Graph Question panel
Enter your question into the Graph Question panel by selecting the panel, and typing in the (enter question) area.
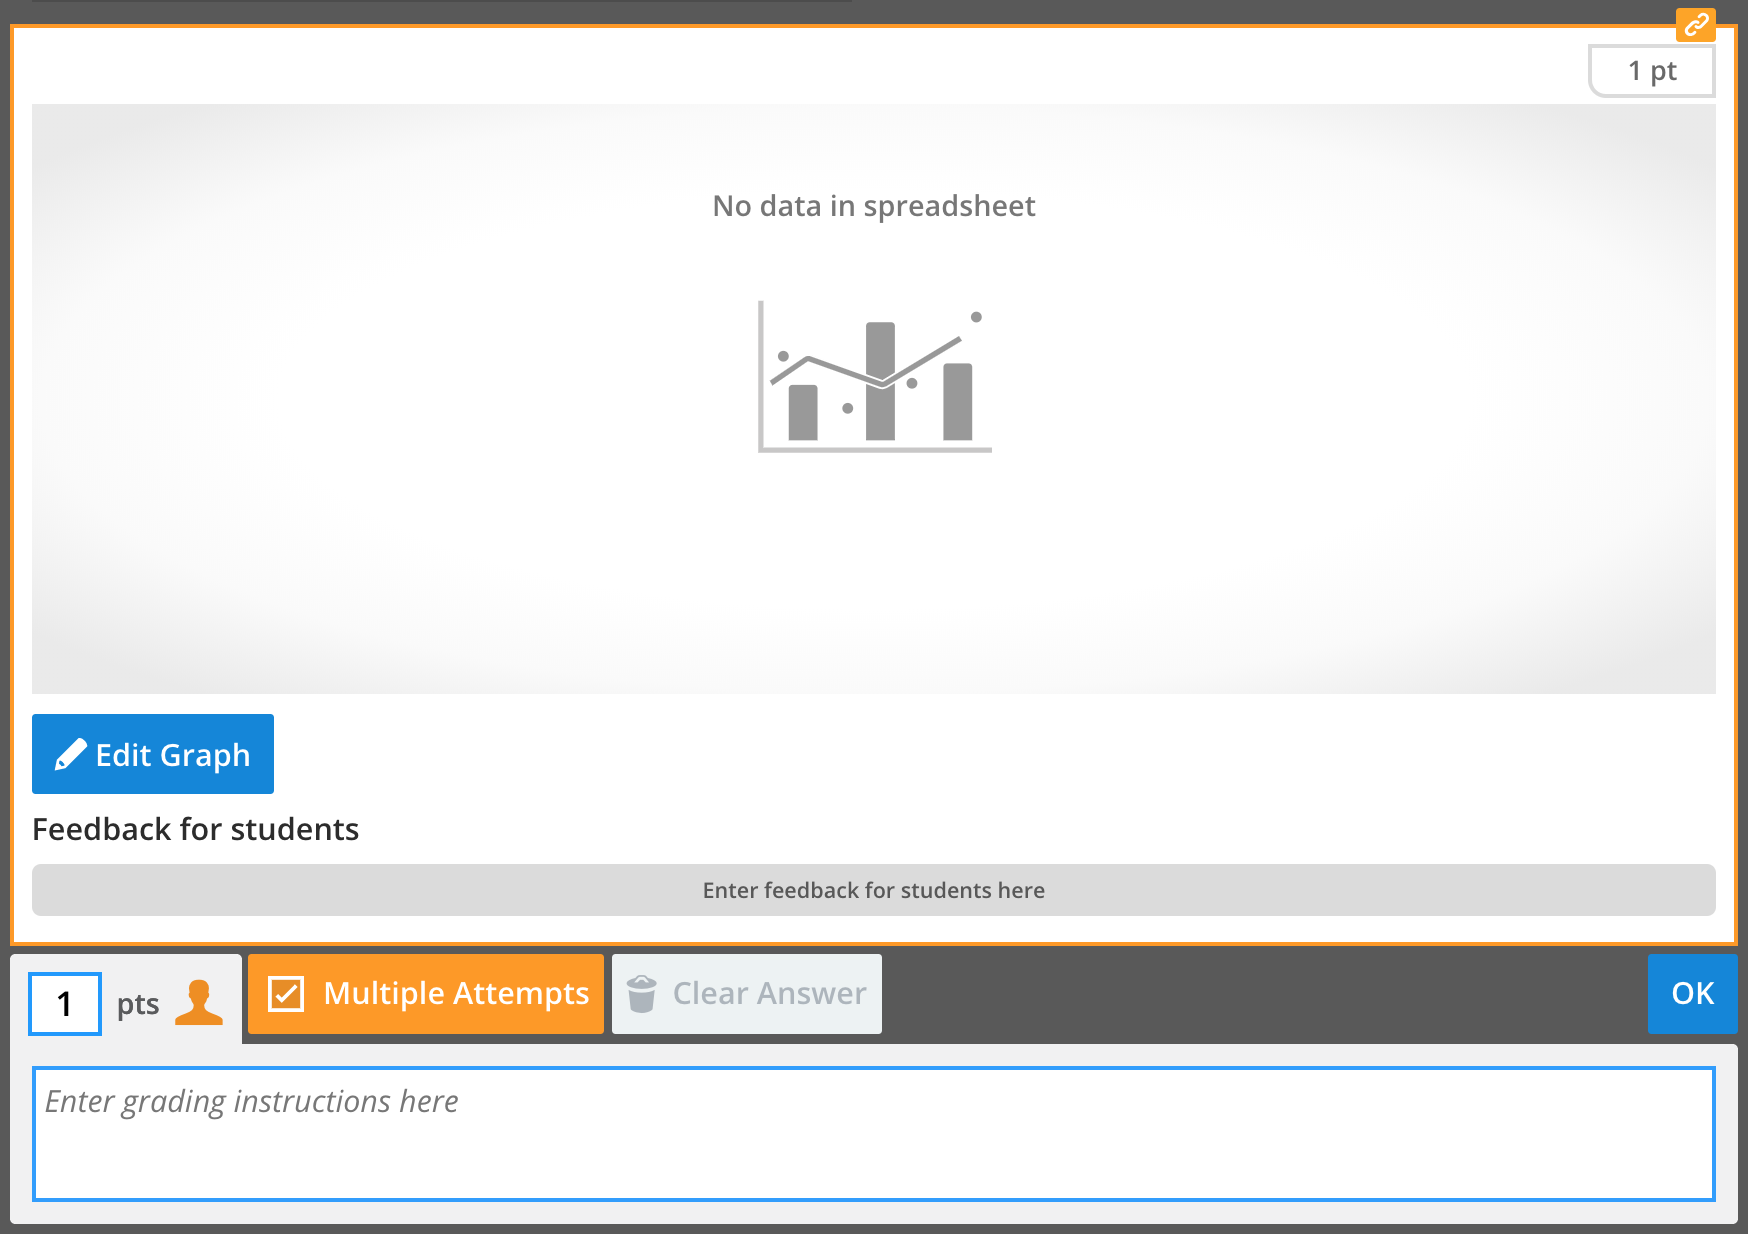
The panel can be left blank, or an initial graph can be created which students can then modify. To set a default graph, select Edit Graph, and create a graph the exact same way as a normal graph panel. Remember that this is what the students will see initially when they open the page.
Adding feedback
To provide a model answer, edit the panel and choose an assessment type, then click Set Answer.

From this view you can set a model answer by selecting Edit Graph. You can also add information about the model answer for students, enter grading instructions for graders, change the number of points assigned, or turn off Multiple Attempts.