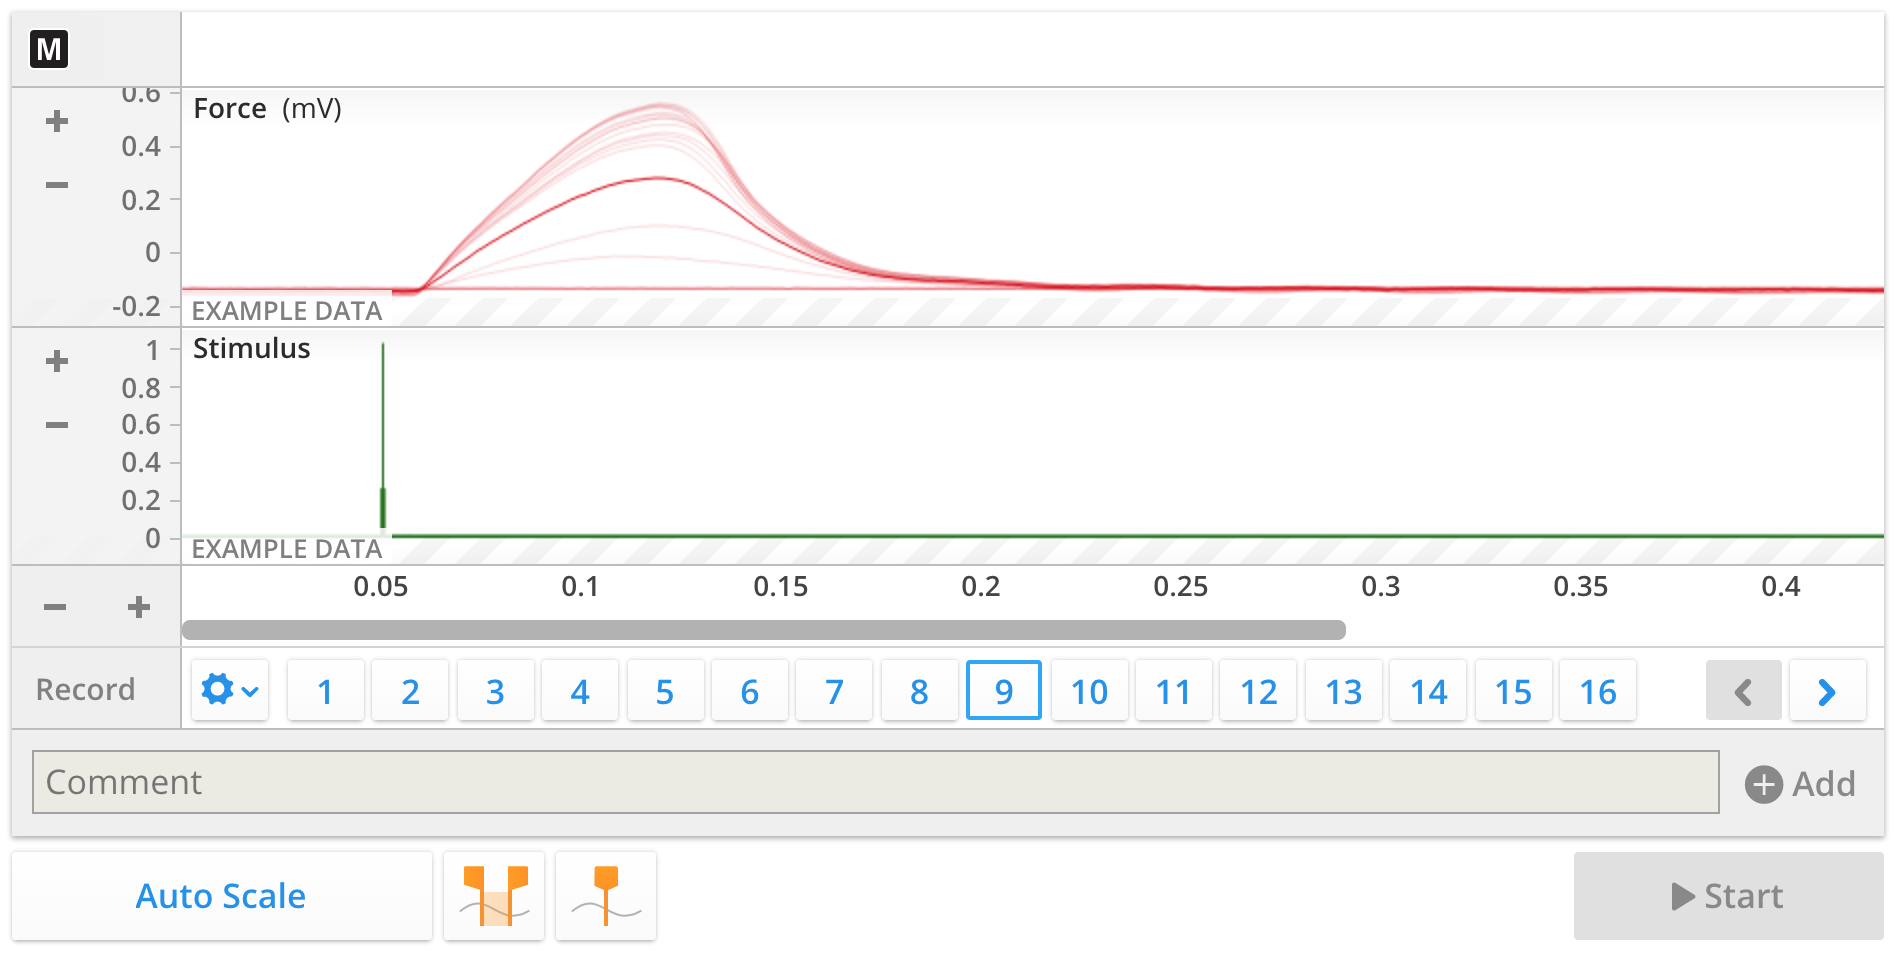
The Scope Sampling panel is used for displaying and recording signals from PowerLab data acquisition units in a different way to the Data Sampling panel. Each data record or block of data in the Scope Sampling panel is represented on an individual page, creating a list of recorded waveforms that are overlaid for analysis. Watch this video to see it in action.

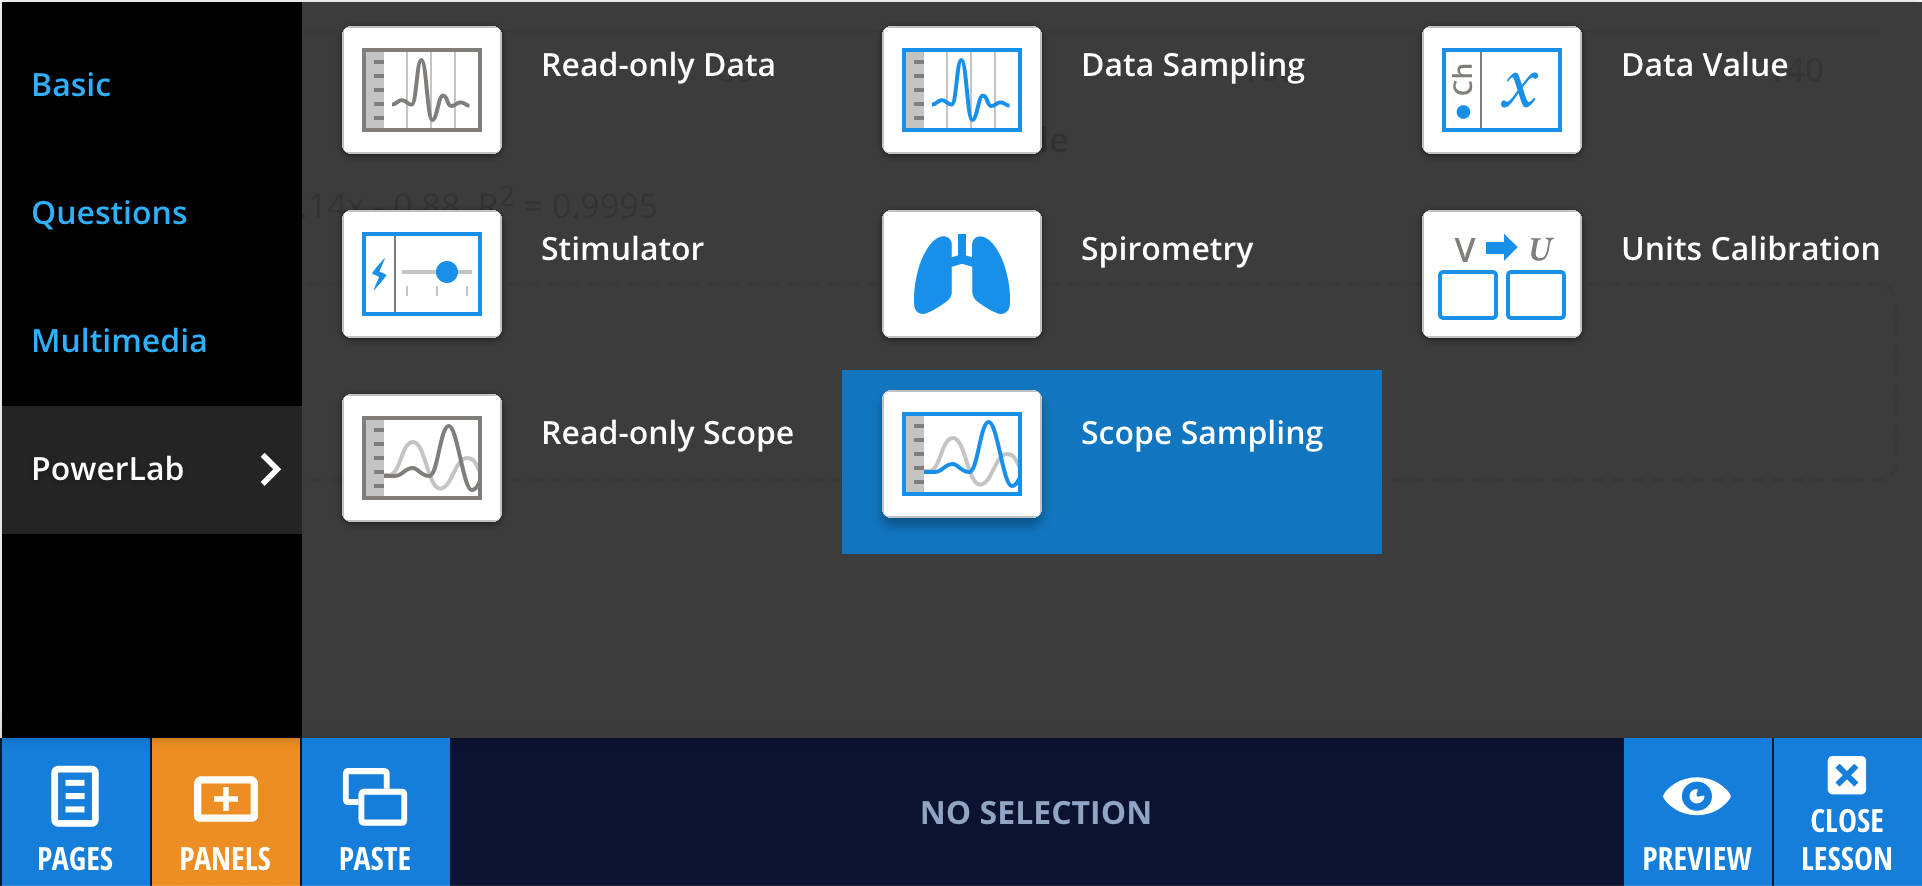
The Scope Sampling panel can be found by selecting PANELS from the footer, and then selecting PowerLab:

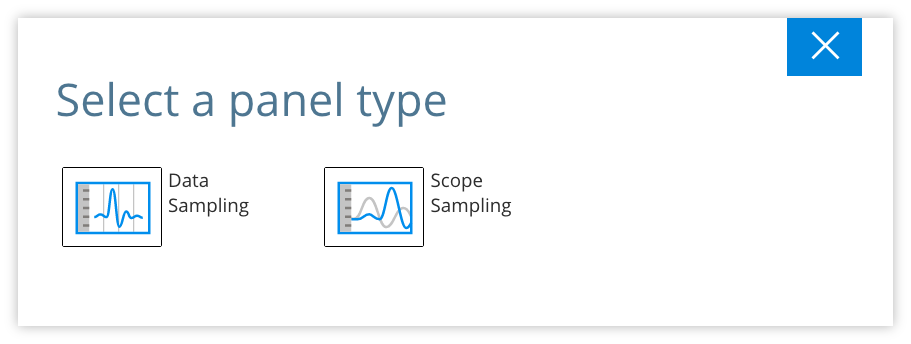
Drag and drop the Scope Sampling panel to wherever you like on the lesson page. Just like any other panel, a blue line will indicate where your panel will line up. You can easily rearrange panels if you’re not happy with the layout.
Next, Edit the panel and add the settings file (.adiset) you wish to use. As with the Data Sampling panel, you can use the drop down menus to turn on Channel and Time value readouts that will display while sampling.
You can also drag and drop a LabChart settings file (.adiset) onto the menu options cog icon  and select the Scope Sampling panel from the available options.


Like Question panels, authors can set question text. To add a model answer for the students, select Set Answer, then Add Data. Or simply drag and drop a LabChart Data File (.adicht) onto the panel.
To facilitate communication between the Scope Sampling panel and the PowerLab, the kuraCloud Desktop Application (kCDA) must be installed. With kCDA installed, you can select Start to watch data stream into the panel.