
Analyzing your Equivital data in LabChart
Equivital's wireless physiological monitoring system allows you to accurately record human physiological data such as ECG, breathing rate, skin temperature and acceleration on a stationary or moving subject. When combined with LabChart, you have a range of comprehensive analysis tools at your disposal to analyze, extract and manipulate your recorded data as needed.
Below is a short guide outlining how you can use LabChart’s Analysis Modules and the Data Pad tool to analyze data you have recorded using the Equivital wireless physiological monitoring system.
Unsure how to import your data into LabChart? Check out our how-to-guide covering the basics of live streaming and importing logged data into LabChart.
The following video contains data obtained from an overnight sleep experiment where the subject was wearing a sensor belt connected to a Sensor Electronics Module (SEM). For additional measurement options check out the Equivital accessory range.
Using LabChart’s Analysis Modules
In this section we will cover how to use LabChart's Analysis Modules to analyze your data, specifically the ECG Module. First you will need to open LabChart and either import logged data from your Equivital SEM or view data you have recorded from a live streaming experiment. Please visit our ‘Getting started with Equivital’ guide if you are unsure how to do this. All LabChart Analysis Modules are included with LabChart Pro, otherwise they can be purchased and downloaded separately.
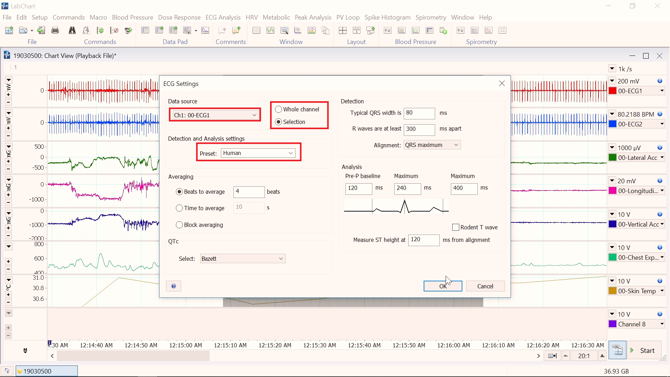
To analyze your data using one of the LabChart modules, you will need to start by selecting the data you wish to analyze. Once you have done this, go to ‘ECG analysis’ and ‘Settings’ and make sure that the ‘Data Source’ has been selected correctly. Following the example in the video, you would chose to analyze a ‘selection’ of data rather than the ‘whole channel’. Here you can also check that the ‘Detection’ and ‘Analysis’ parameters have been selected appropriately. Make sure that your ‘preset’ under ‘QTc’ is representative of your experimental model i.e. in this example we have used a human subject. Once you have finished, you can click ‘OK’.
Now you can look at the various analysis tools that the ECG Module provides you with under ‘ECG Analysis’. The ‘Classifier View’ will allow you to determine whether any of the waveforms are artifact and the ‘Table View’ will give you a number of options for reporting on the data you have analyzed. Additionally, the ECG Analysis Module automatically allows you to detect and analyze all the intervals and amplitudes at the various parts of your waveform - giving you a quick and easy way to get an idea of the condition of the subject.
Adding calculations in LabChart
In addition to using the ECG Module, you may wish to analyze other parameters such as the heart rate or breathing rate of the subject over the course of the experiment.
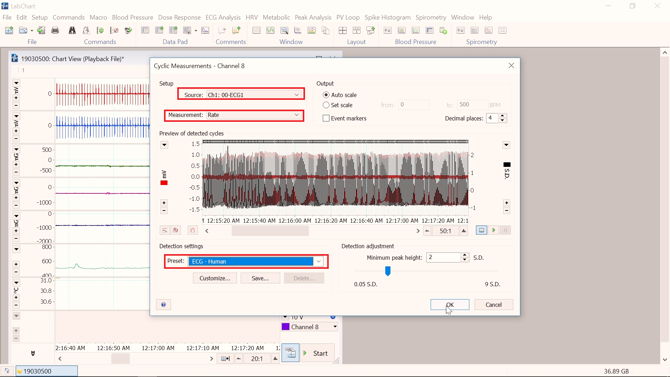
To do this you will need to create a new channel by right clicking on an existing channel and selecting ‘Add Channel’. Click on the name of the new channel to open a drop down menu and select ‘cyclic measurements.’ This will bring up a new window.
Make sure that 'ECG' is selected under source and that you change your measurement to ‘rate.’ Under detection settings, make sure that you select the appropriate preset. In this case, we will select ‘ECG-human’. Now, if you click ‘OK’ you should have a heart rate channel (BPM).
To add a respiratory rate calculation, follow the same set of instructions as above, but this time you will select ‘chest expansion’ as the signal of interest under source and ‘Respiration-respiratory Belt’ as the preset.
Using the Data Pad function
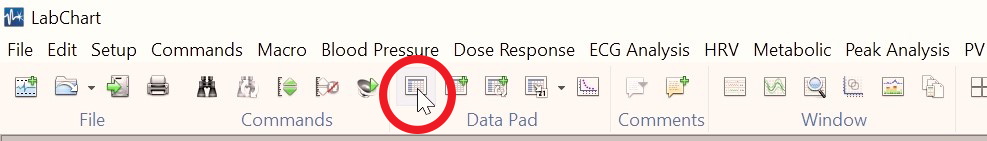
The Data Pad is a LabChart Window in which the user chooses parameters to be extracted from selections of LabChart data and tabulates the analyses. It is also one of the most underutilized tool sets! In this section we will briefly cover how to do some basic analysis using the Data Pad tool. Open Data Pad from the toolbar as shown in the photo below.
By default, each of the columns in Data Pad will represent a different data channel. With this, you can set up each column to perform a specific calculation for each of your data channels. In this example we are going to click on the heading of the first column and select ‘Statistics’ and ‘Mean’ and choose the heart rate channel we just created as our ‘source channel’. We will do the same in the neighboring column, but this time select respiratory rate as our source channel. You can move between different columns by using the directional arrows at the top of the window. Select ‘Off’ for the remaining columns as shown in the video. Now you can select areas of your data you are interested in and calculate the mean breathing rate and heart rate of your subject during that time period. To add values from specific time intervals to your Data Pad, you can highlight the region you are interested in and go to the ‘Command’ menu at the top of LabChart and select ‘Add to Data Pad’. The contents of the Data Pad can also be copied to other applications, printed and/or saved as a text file.
Related: Explore the inner workings of Data Pad (webinar)
In this guide we have covered some simple analysis techniques for analyzing your Equivital physiological data including how to use the ECG Analysis Module, add a calculation channel and use the Data Pad function. Hopefully you now feel comfortable analyzing your Equivital data in LabChart!
Check out these links for more information on:
- Using the Equivital wireless physiological monitoring system
- Using Data Pad
- ECG Analysis Module
- Downloading LabChart Modules