


Pressure-volume (PV) loops are the gold standard for measuring direct, real-time cardiac function. By simultaneously plotting real-time ventricular pressure against ventricular volume, PV loops provide a unique, quantitative approach for determining the contractility of the heart, independent of preload and afterload.
A pressure-volume catheter is inserted directly into either the left or right ventricle. Pressure is measured directly by a pressure sensor. In Millar PV catheters, this is a solid-state MEMS sensor - a silicon chip that flexes with each pressure pulse. Once zeroed, the pressure measurement is the direct result of pressure changes in the ventricle exerted upon that MEMS sensor.
Unlike non-continuous measures such as echocardiograms and cardiac MRI, PV catheters measure volume continuously, but indirectly via electrodes. A small, high-frequency electrical current is generated between the outermost electrodes on the pressure-volume catheter. The resulting conduction of that electrical field is measured by the innermost electrodes on the catheter, and this measurement forms the basis for the volume measurement.

A pressure-volume loop graphs pressure against volume within the ventricle to produce a load-independent measure of cardiac function.
Your catheter needs to be calibrated to account for the influence of cardiac muscle conductivity and electrical field inconsistencies on that volume measurement. There are two options for calibration: admittance or conductance.
Admittance
Millar MPVS Duo: Admittance Set Up
Admittance calibration is performed pre-experiment. When performed correctly, admittance
calibration accounts for variation in cardiac muscle conductance over the course of a cardiac cycle using Wei’s equation. By measuring both the magnitude and the phase angle of the electrical signal (or measuring at multiple frequencies), the admittance system can differentiate more effectively between the electrical signal passing through the blood and the signal passing through the capacitive heart muscle in real-time.
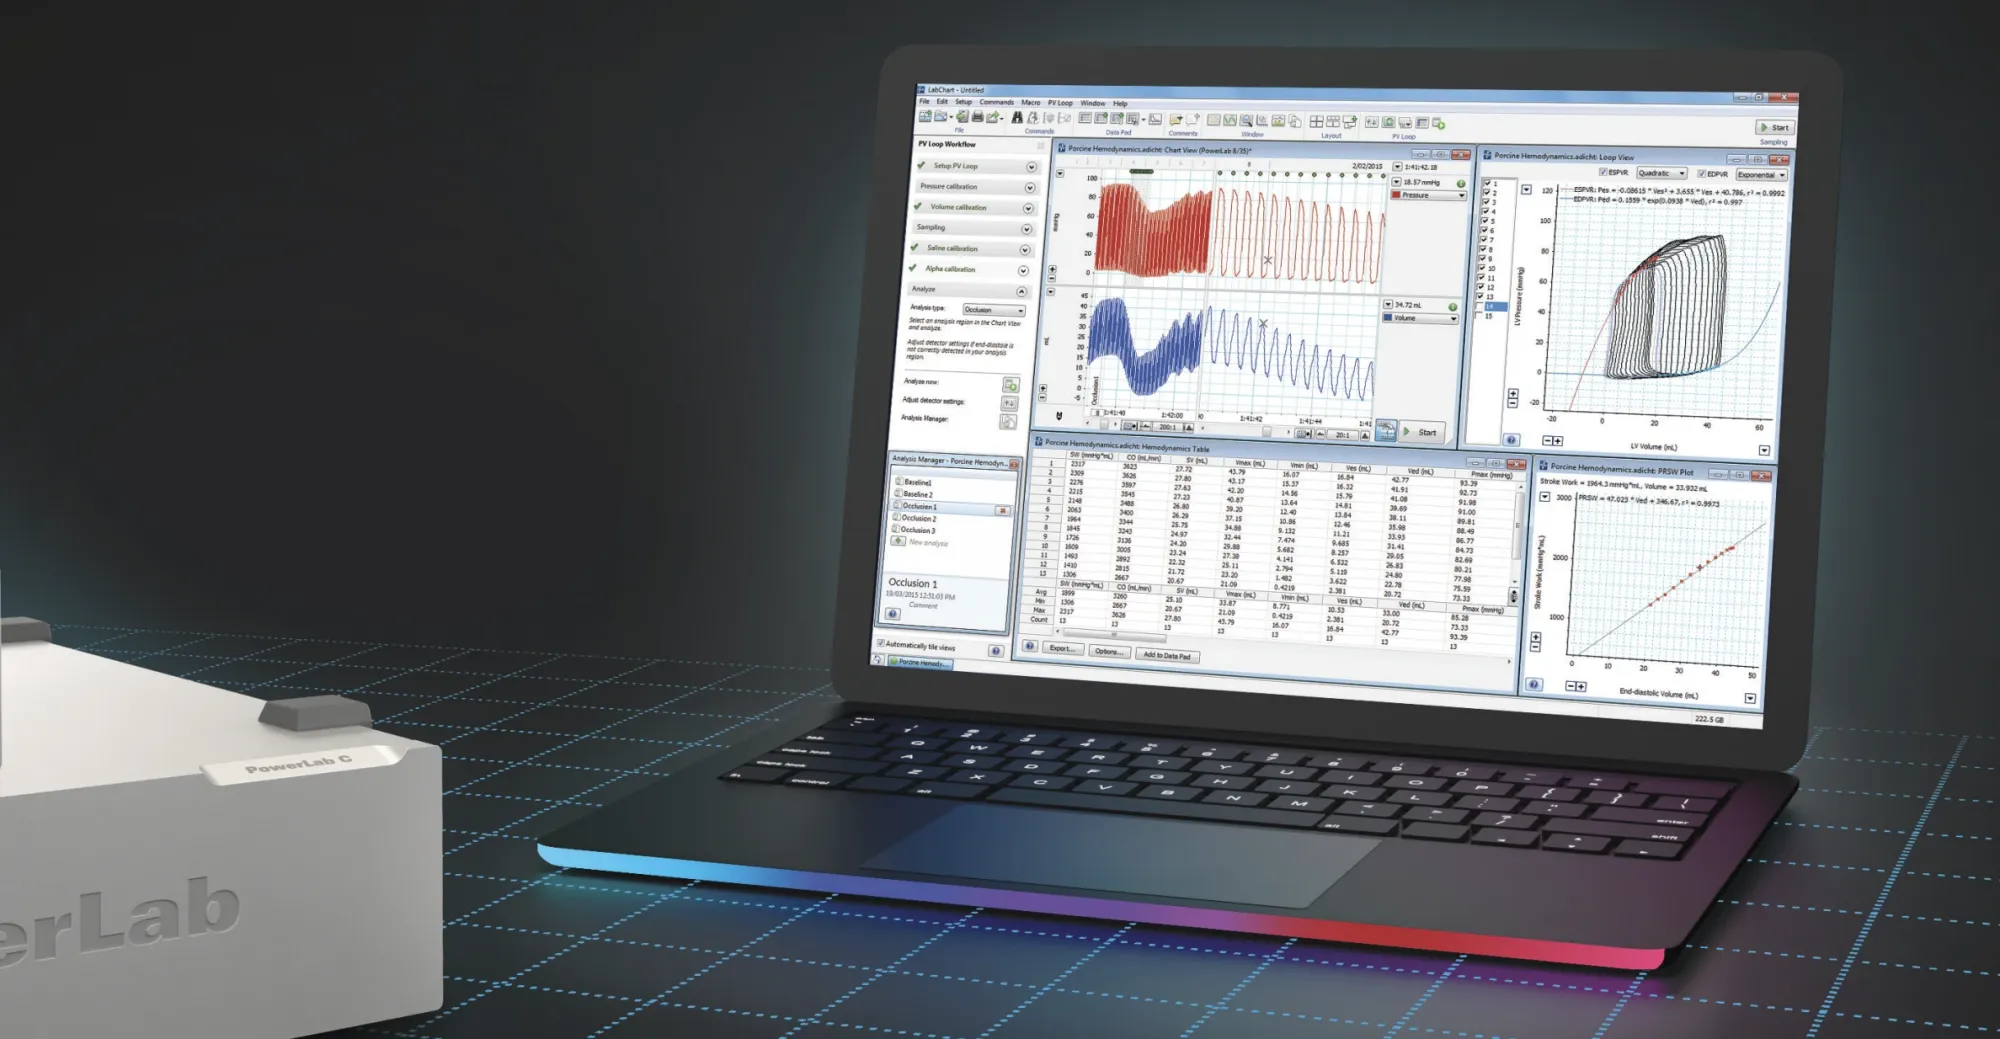
Admittance calibration is now available with the MPVS Duo through the LabChart PV Loop Module
Calibration within the MPVS Duo
There are three values you will need to measure ahead of time to accurately perform admittance calibration: K, SV, and Rho.
Muscle (K)
The ‘muscle’ value is also known as the sigma/epsilon (S/E) ratio, and refers to the electrical conductivity of the myocardial tissue. The conductivity/permittivity of the myocardium impacts the overall volume measurement, and so must be accounted for as part of controlling for parallel conductance.
The typical default values for a heart are:
- Healthy heart (800K)
- Myocardial Infarction (900K)
- Hypertrophied (700K)
However it is recommended that you explore the relevant literature to determine an appropriate K value for your subjects.
Stroke Volume (SV)
This is an independently measured value of the amount of blood ejected by the ventricle in one cardiac cycle, measured using echocardiography, an aortic flow probe, or thermodilution. This externally measured reference scales the relative volume change detected over a cardiac cycle. By matching the catheter's calculated stroke volume to this reference value, a correction factor is determined to convert the catheter's signal into absolute volume units (mL).
Blood Resistivity (Rho)
Blood Resistivity default values are loaded directly from the attached catheter. Experimental interventions, such as the administration of fluid, can change the blood resistivity of the animal model.
Conductance
Millar MPVS Duo: Conductance for Small Animals Set Up
Conductance calibration is performed post-experiment. Conductance calibration estimates ventricular volume by measuring the electrical conductance of the blood within the ventricle, using Baan’s equation.
Conductance calibration relies on correctly determining the conductivity of blood within the ventricle by using cuvette calibration, performing a saline bolus, and applying an alpha calibration factor to collected data, after the experimental phase has ended.
Post-processing with the MPVS Duo
Cuvette Calibration
The catheter is inserted into a known volume of blood to convert the conductance value into real volume units.
Subtraction of Parallel Conductance
Parallel conductance is the extent to which the surrounding heart tissue contributes to the volume signal. This is controlled by performing a saline bolus (injecting a small amount of saline into the ventricle) after the intervention phase of the experiment has ended and observing the change in the measured conductance signal. The saline will only alter the ventricular blood pool, which allows you to calculate and subtract the parallel conductance of the cardiac muscle.
Alpha Calibration
Baan’s equation assumes that the electrical field produced by the pressure-volume catheter is uniform, but that is not necessarily the case. An alpha calibration factor is introduced as part
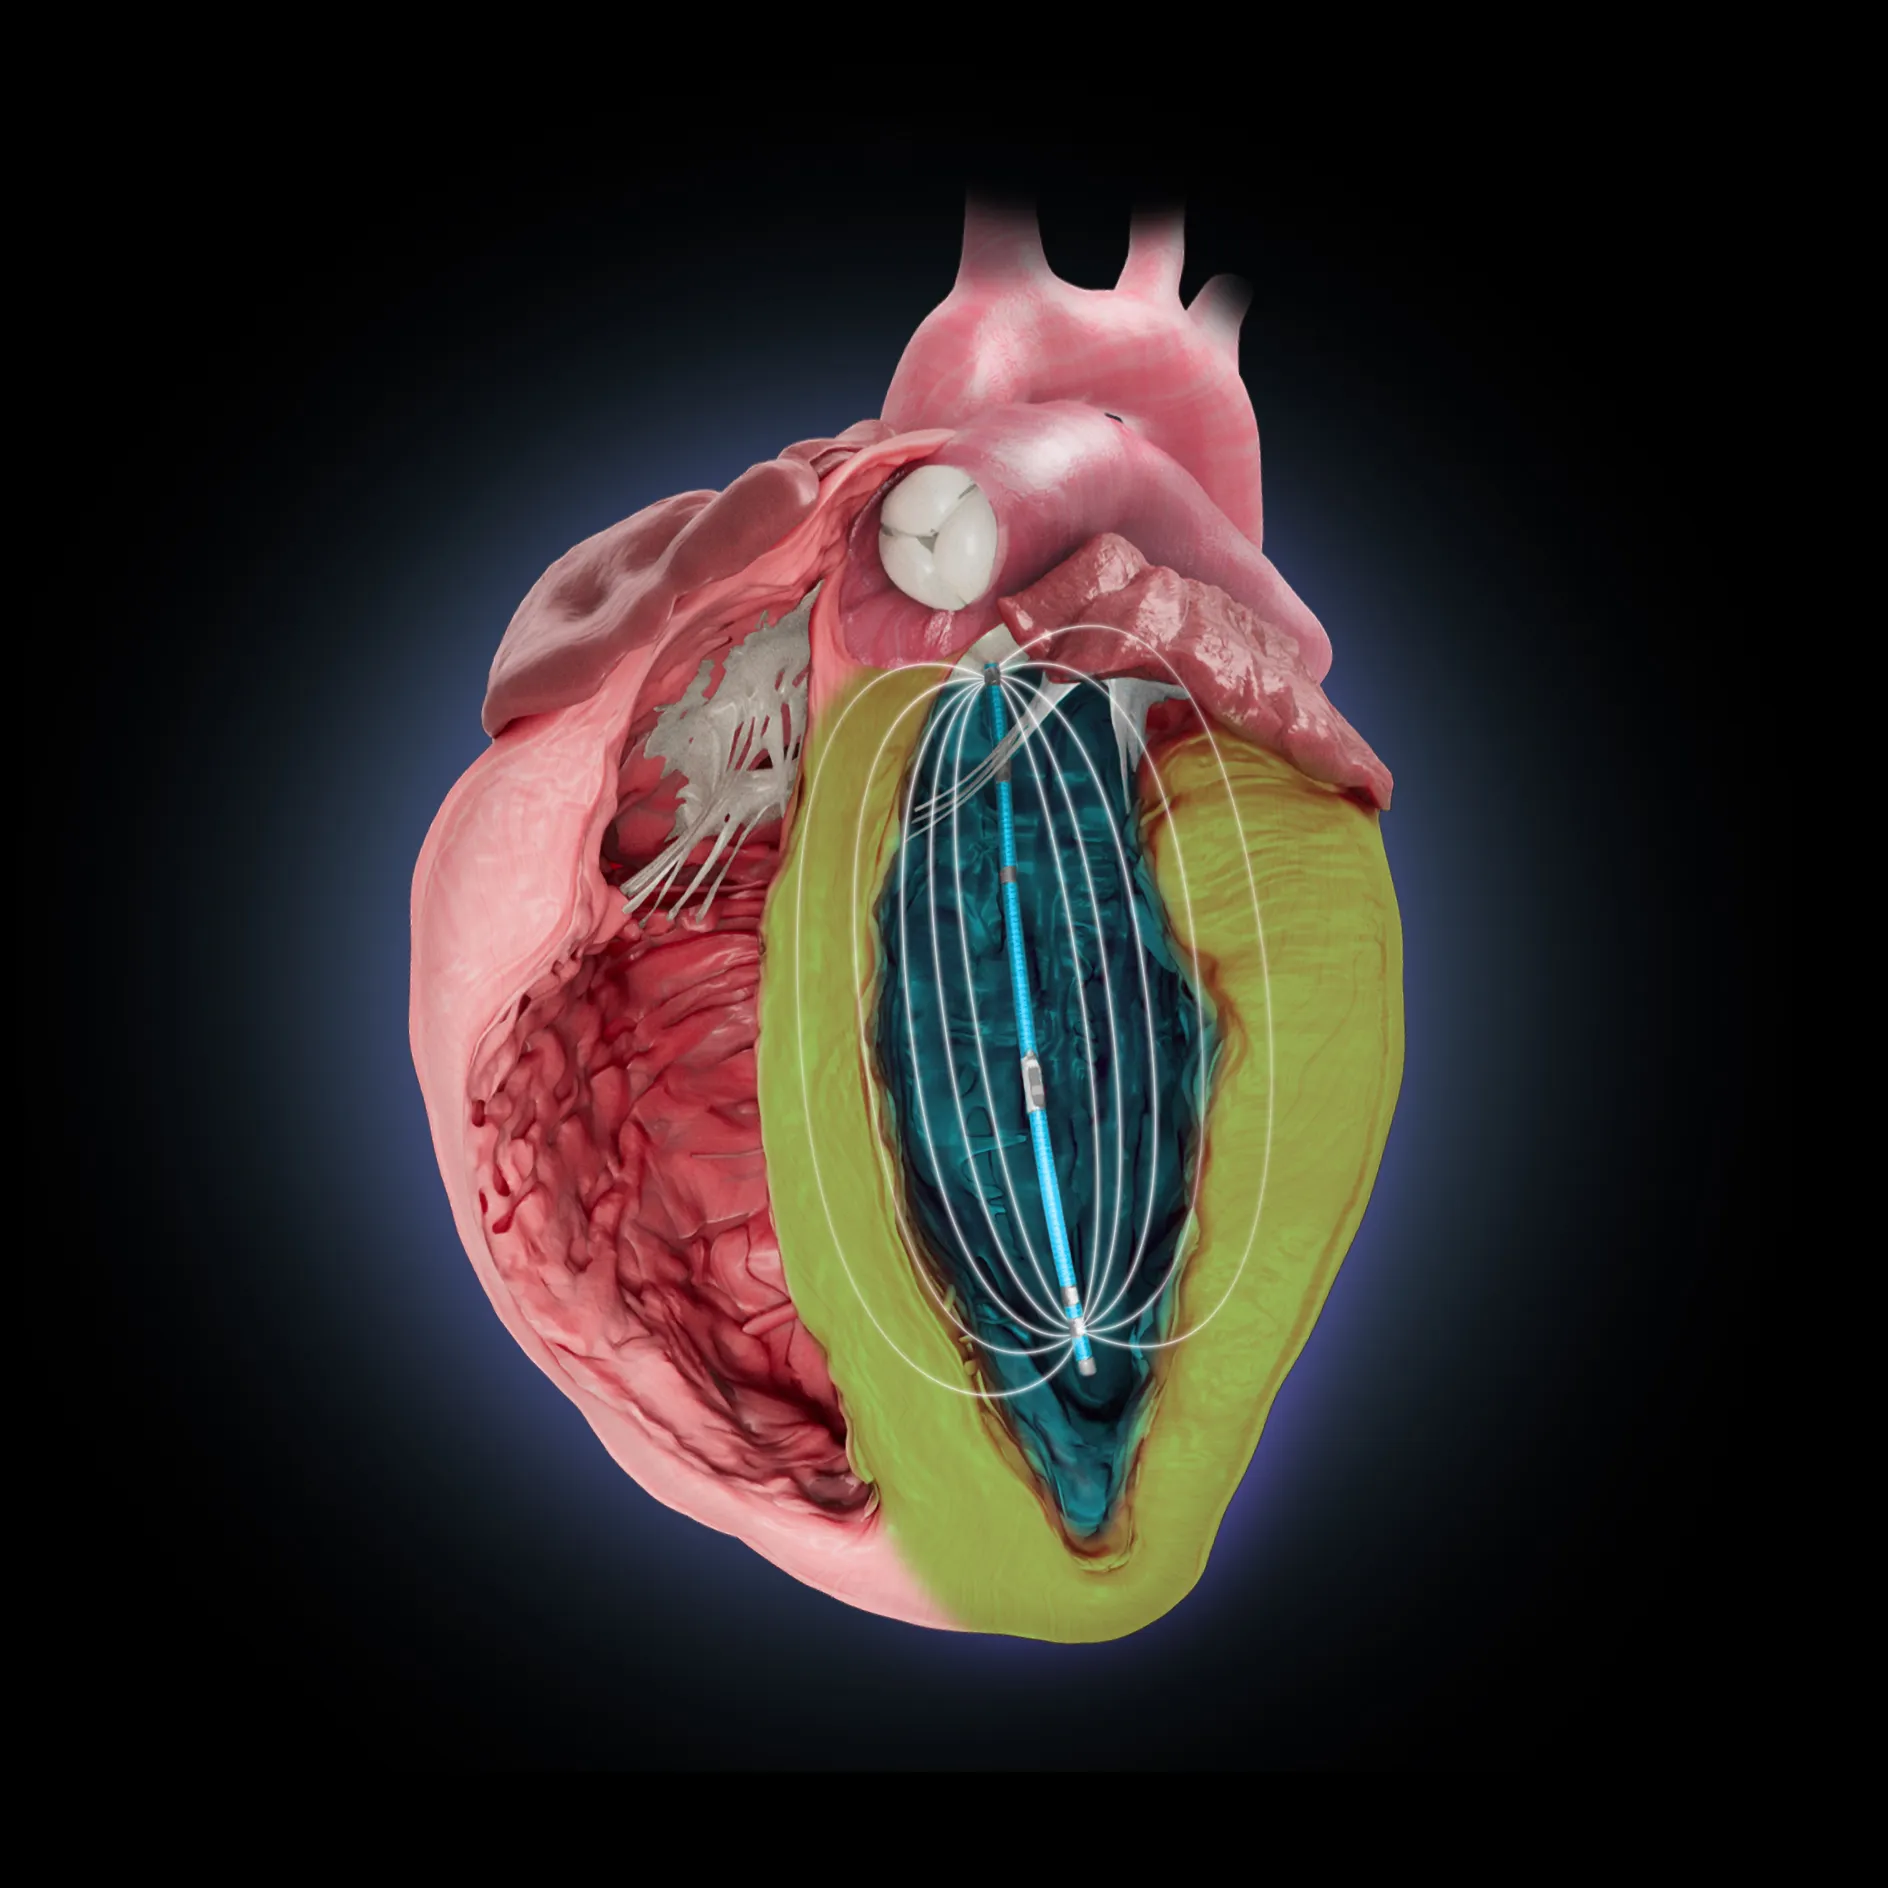
Parallel conductance is the interference of heart muscle tissue in the volume measure, and needs to be calibrated for.
of the equation to correct for that assumption, adjusting for any over- or under-estimation of ventricular volume due to that initial assumption.
The alpha value is determined by taking an independent volume measurement, such as echocardiography, MRI, thermodilution, or aortic flow probe, and relating it to the change in conductance signal.
Calibration Comparison Chart

Related Articles
Introduction to PV loops: Understanding points on the PV loop and measures of cardiac function >>
Understanding the Importance of PV Catheter Calibration in Admittance and Conductance Systems >>
Related Products