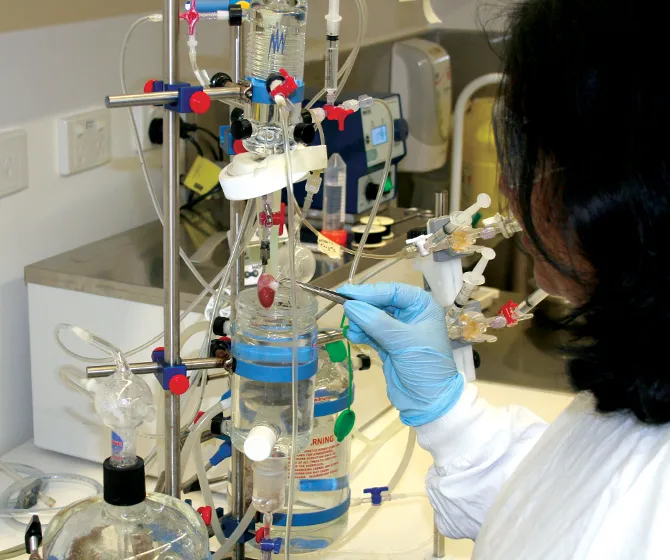
Langendorff Isolated Heart Perfusion Systems
With our Langendorff isolated heart perfusion systems you can monitor an isolated heart while perfusing the coronary arteries with a nutrient solution. This allows you to record and analyze multiple cardiac parameters such as left ventricular developed pressure, perfusion pressure, cardiac electrical activity, heart rate and temperature all in real time.
ADInstruments' isolated heart perfusion apparatus and complete perfusion systems support your use of the Langendorff isolated heart perfusion technique to perfuse all sizes of heart models, from mice, rats, and guinea pigs, to porcine hearts.

Products and Solutions
Record multiple
signals at one time
Compact and modular options available
Mix and match products
for a custom solution
Integrate all your data
streams in one place
Our Langendorff perfusion systems provide everything you need for isolated heart research:
- Perfuse all sizes of isolated hearts from mice, rats and guinea pigs, to porcine hearts
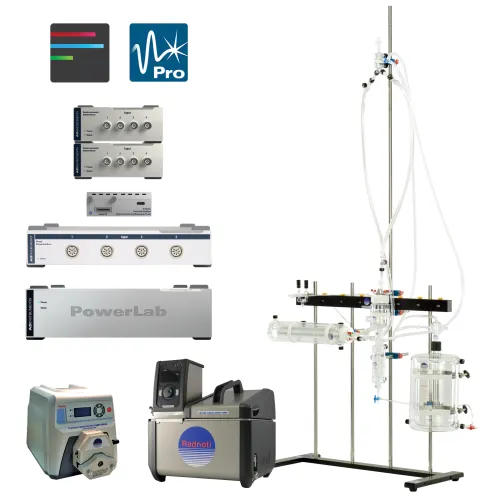
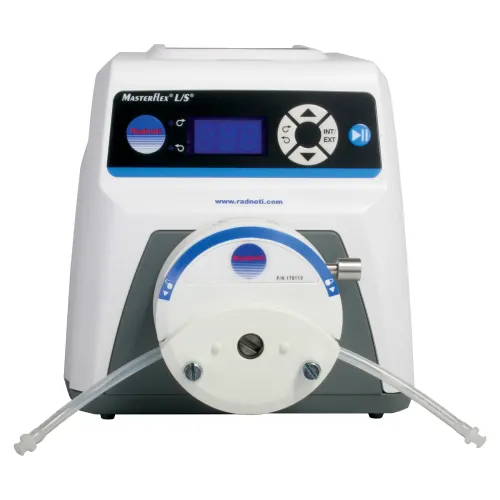
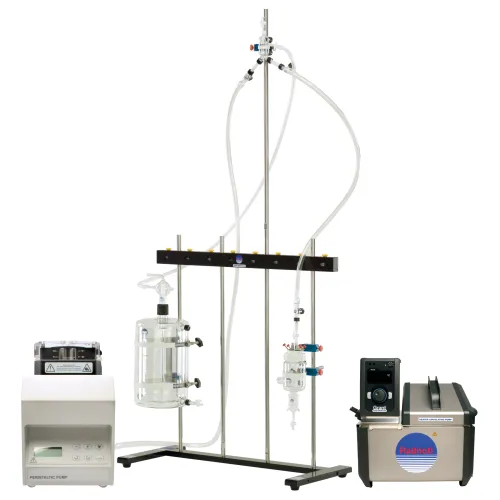
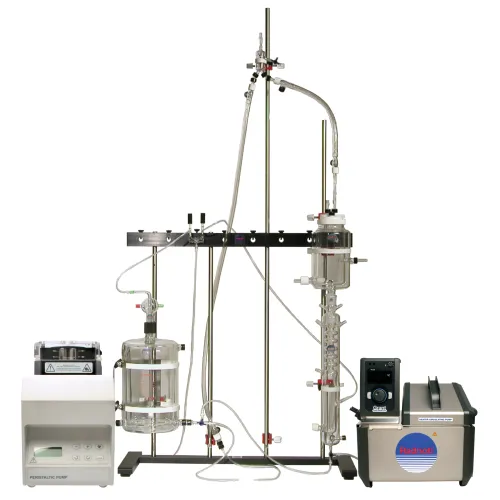
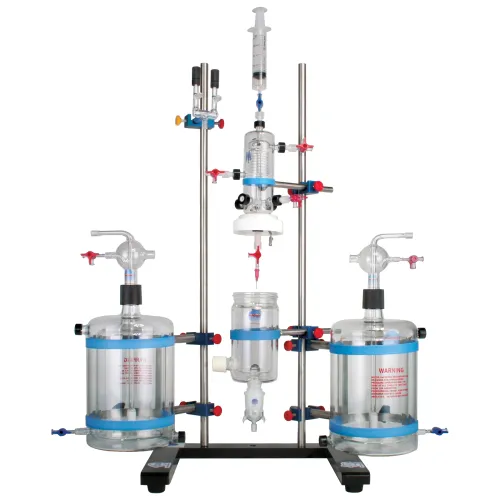
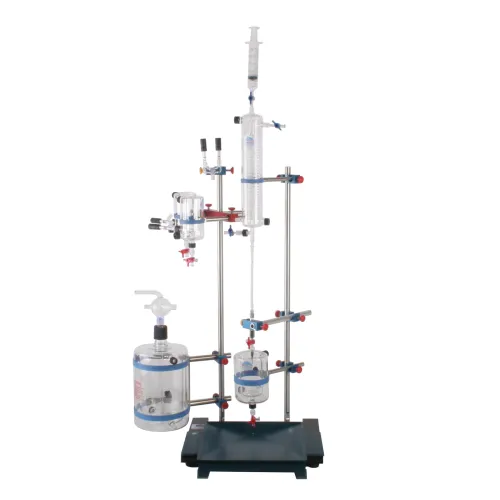
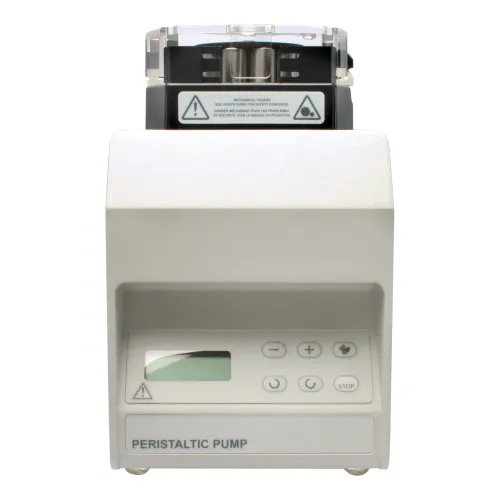
- Choose from a compact perfusion system which utilises a peristaltic pump and STH pump controller for constant flow and pressure or more traditional modular isolated heart apparatus
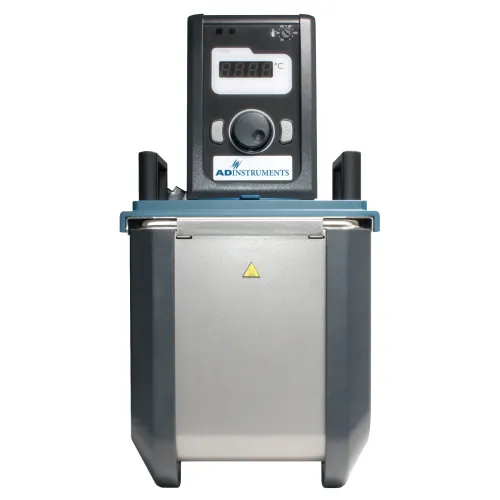
- Maintain constant temperature with a heater water bath, water jacketed tubing, components and heart chamber
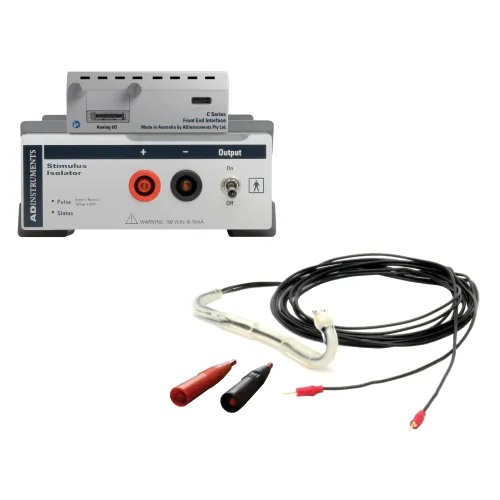
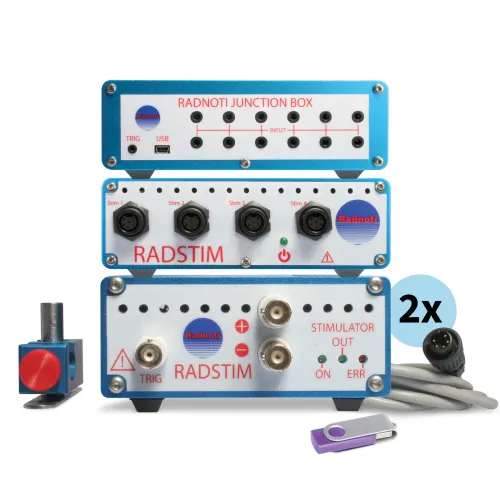
- Easily switch between constant-pressure and constant flow modes to investigate coronary artery function while the heart beats spontaneously or with the help of an external stimulator
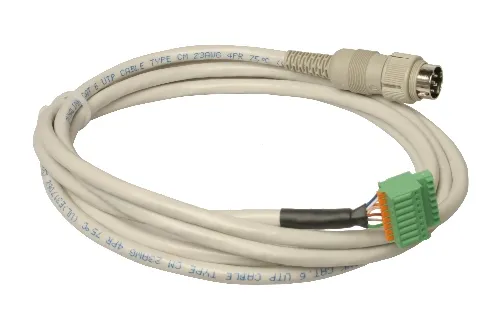
In conjunction with our complete Langendorff perfusion systems shown below, any device with an analog output (+/- 10V) can be connected to a PowerLab data acquisition system for synchronization of event in LabChart. So you have even more flexibility and can integrate all your data streams in one place.
All of our hardware is backed by the appropriate safety certification standards. More information on safety standards.
Resources for Isolated Tissue-Organ System Success
What is an Isolated Heart Perfusion System?
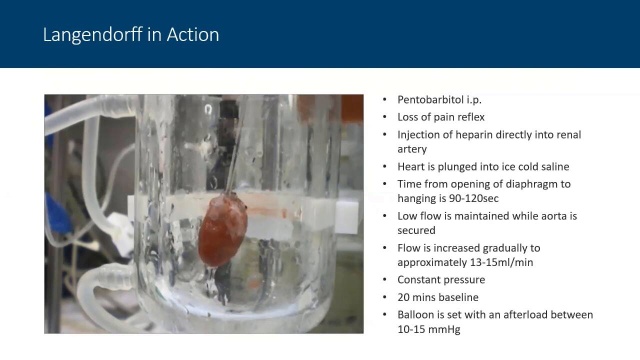
An isolated heart perfusion system is specialized research apparatus designed to maintain and study a heart outside the body in a controlled physiological environment. The Langendorff technique remains the gold standard for ex vivo cardiac research, allowing scientists to study heart function, drug effects, and disease mechanisms in isolation from systemic influences.
A complete Langendorff perfusion system typically includes:
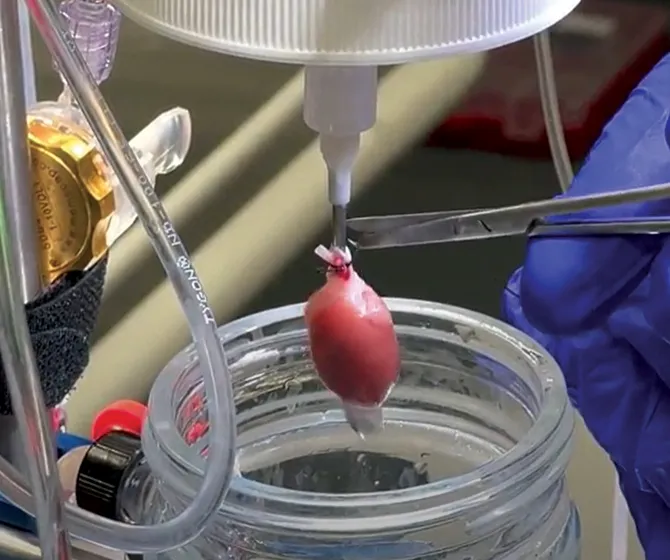
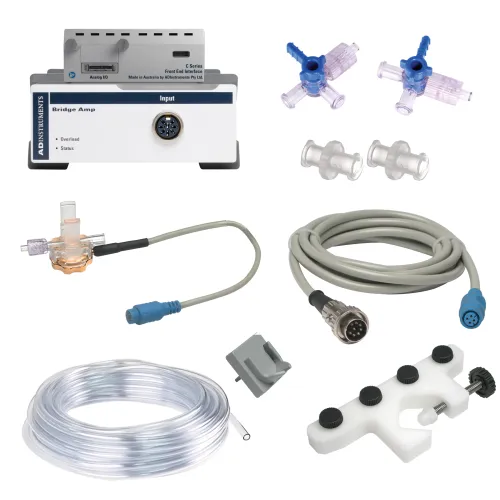
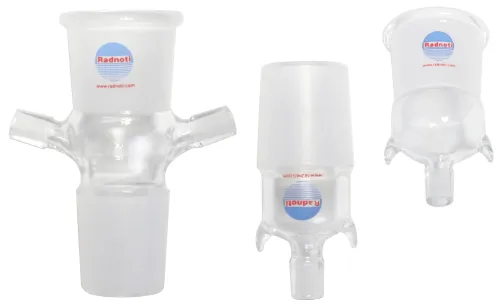
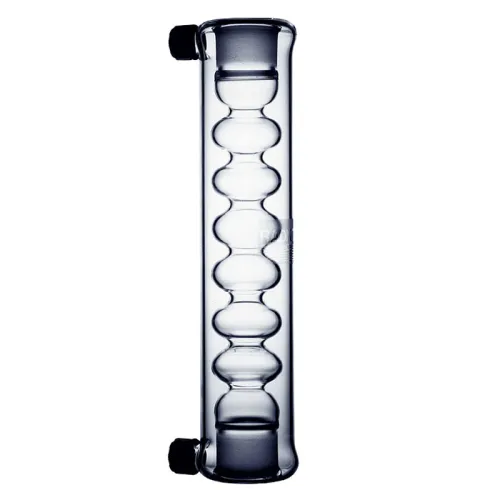
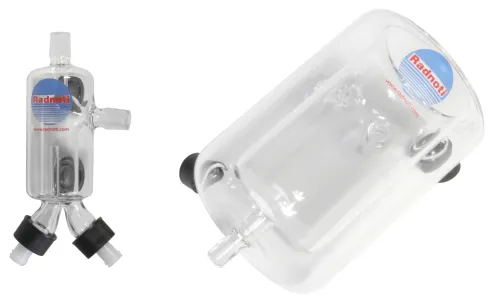
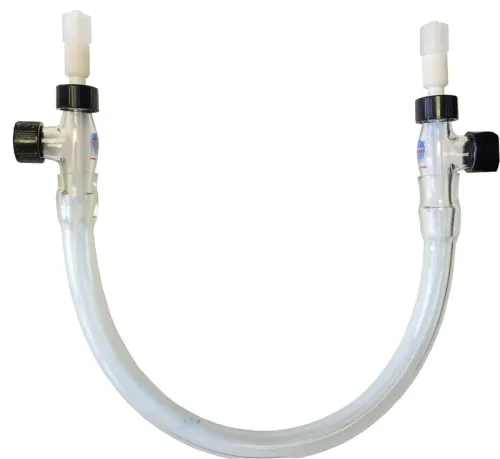
- Perfusion apparatus with oxygenating chamber and bubble trap for delivering warmed, oxygenated perfusate to the isolated heart through retrograde aortic cannulation
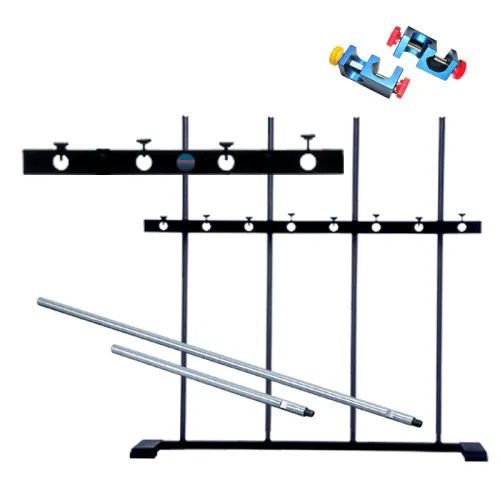
- Temperature-controlled water bath and jacketed glassware to maintain physiological temperature (typically 37°C)
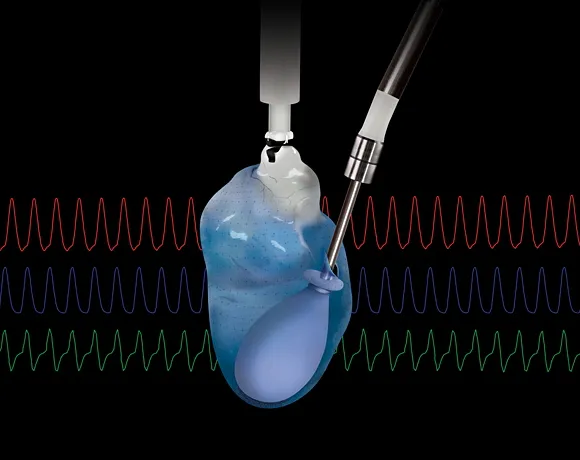
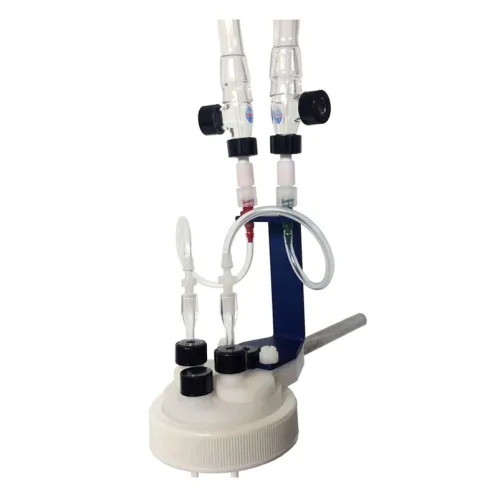
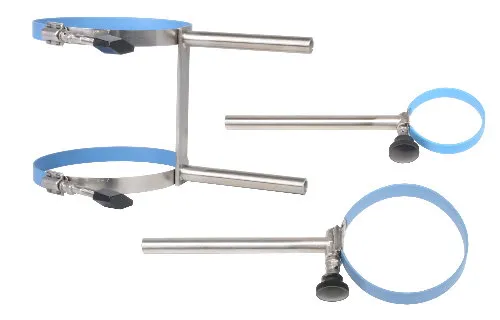
- Heart chamber with cannula mounting for secure positioning and observation
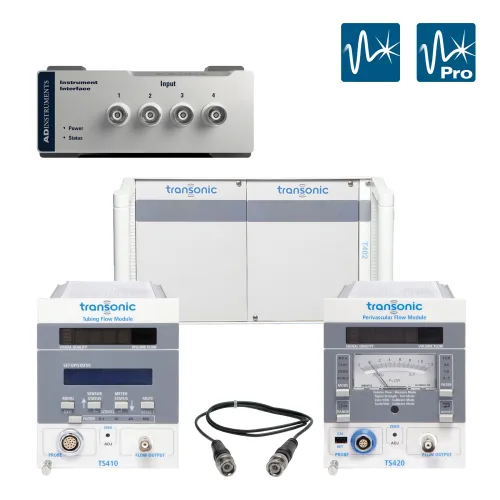
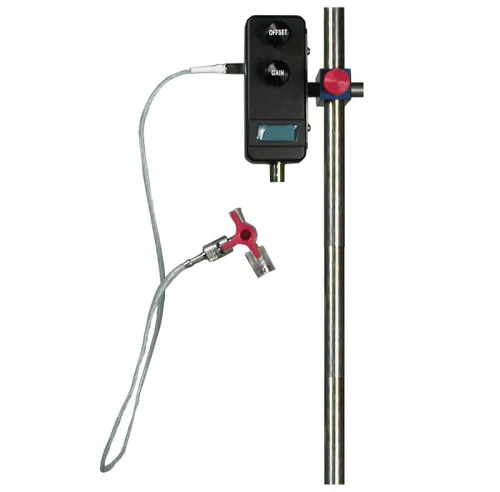
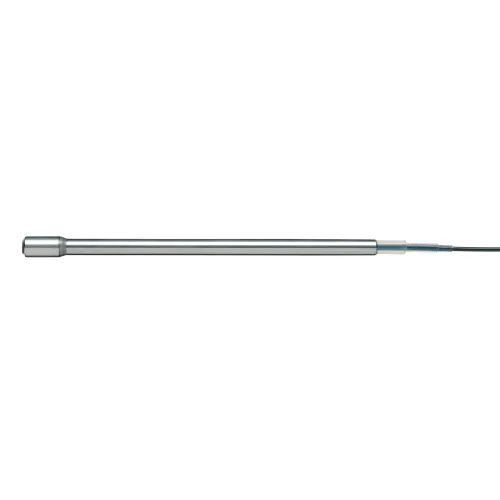
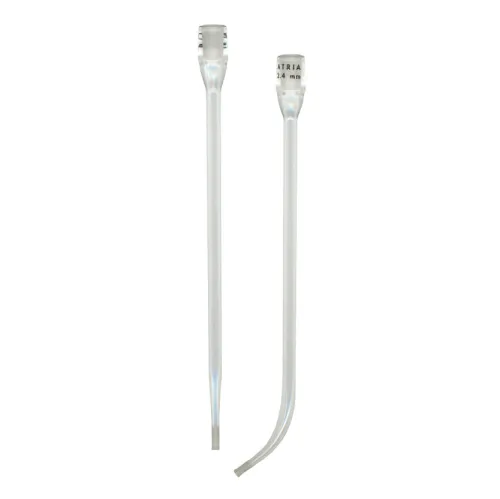
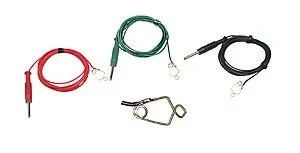
- Pressure transducers and balloon catheters for measuring left ventricular developed pressure, perfusion pressure, and dP/dt
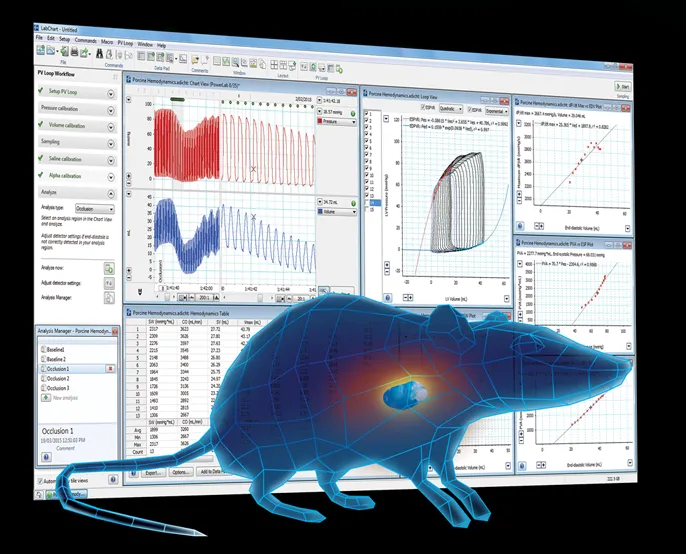
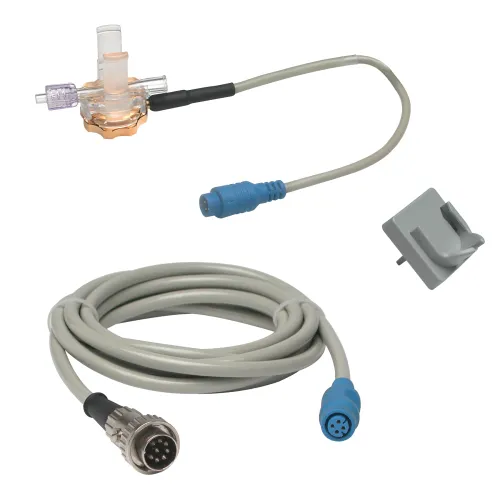
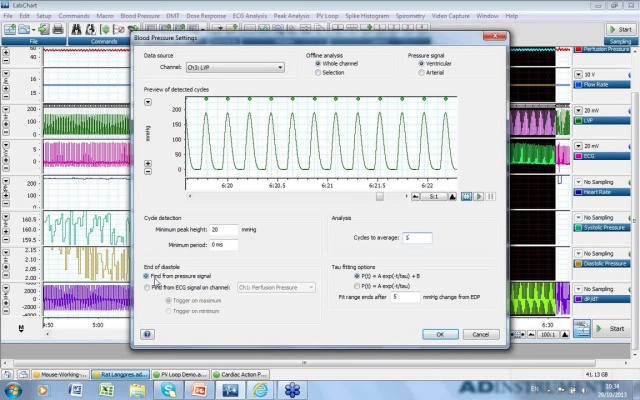
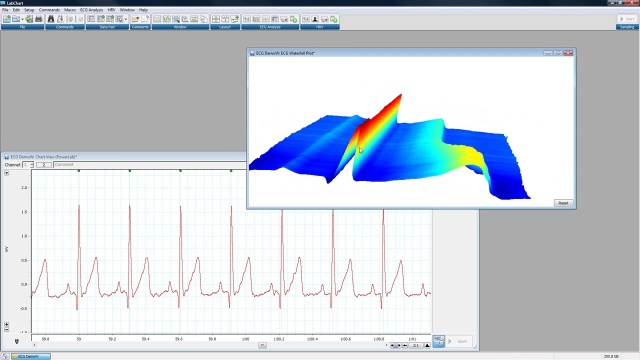
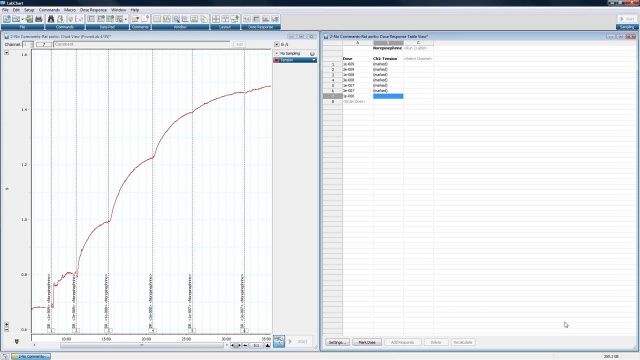
- Data acquisition system (PowerLab) with LabChart software for real-time recording and analysis of cardiac parameters
ADInstruments offers complete isolated heart perfusion systems through our Radnoti glassware range, designed for various species from mouse to larger animal models. Each perfusion system integrates seamlessly with PowerLab data acquisition for synchronized recording of pressure, ECG, temperature, and flow measurements.
Complete Systems or Kits
Related Components and Products


Flexible Data Acquisition
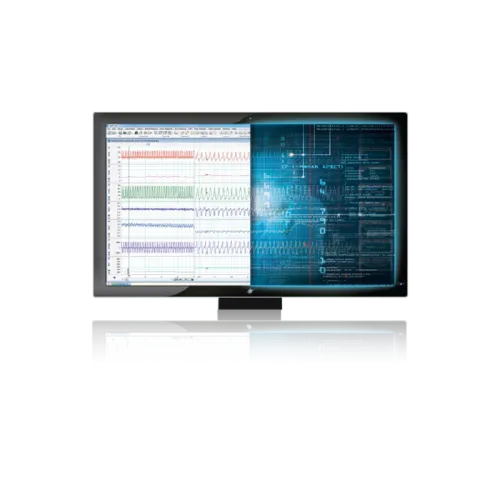
ADInstruments systems provide an integrated solution to advance life science research. With the combination of LabChart analysis software and a PowerLab data acquisition unit, you have the flexibility to collect and synchronize a wide range of signals for analysis. We also offer a range of LabChart compatible solutions able to stream directly in LabChart.
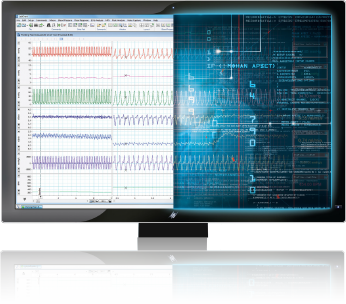
LabChart data analysis software creates a platform for all of your recording devices to work together, allowing you to acquire biological signals from multiple sources simultaneously and apply advanced calculations and plots as your experiment unfolds.

High-performance data acquisition hardware designed for life science research. PowerLab is engineered for precise, consistent, reliable data acquisition, giving you the reproducible data you need while meeting the strictest international safety standards.
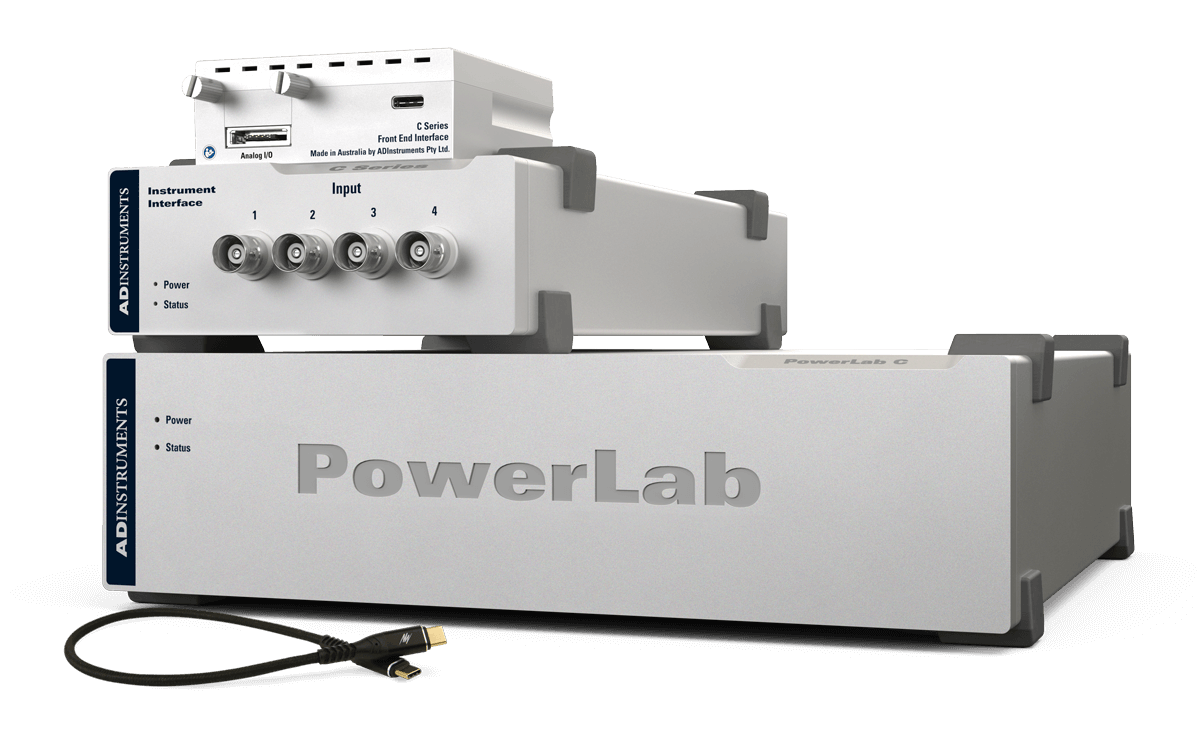
A modular data acquisition foundation system that provides unparalleled flexibility for researchers looking to invest in customizable, reliable solutions for both now, and in the future.
All your analysis in one place
LabChart software is designed specifically for life science data and provides up to 32 channels for data display and analysis options that are powerful and easy to use. With auto-recognition of ADI and LabChart Compatible hardware, multi-window views, one touch recording, simultaneous recording from multiple devices, specialized preconfigured settings, easy sharing options and an interface that can be customized to show only the features you want to use.

Features and Add-Ons
Additional acquisition and analysis options to support your Langendorff Isolated Heart Perfusion Systems analysis:

Citations
4240 papers
in Langendorff Isolated Heart Perfusion Systems on Google Scholar cite ADInstruments.