LabChart features and expandable capabilities
Take full advantage of LabChart's core features, or customize your LabChart experience. With our library of free extensions, device enablers, and paid modules, you can build on LabChart's extensive suite of features to create a DAQ toolbox perfectly suited to your research needs.
Upgrade your LabChart experience by purchasing feature-rich modules designed to streamline intensive workflows, enable advanced analysis, and produce specialized data visualizations.
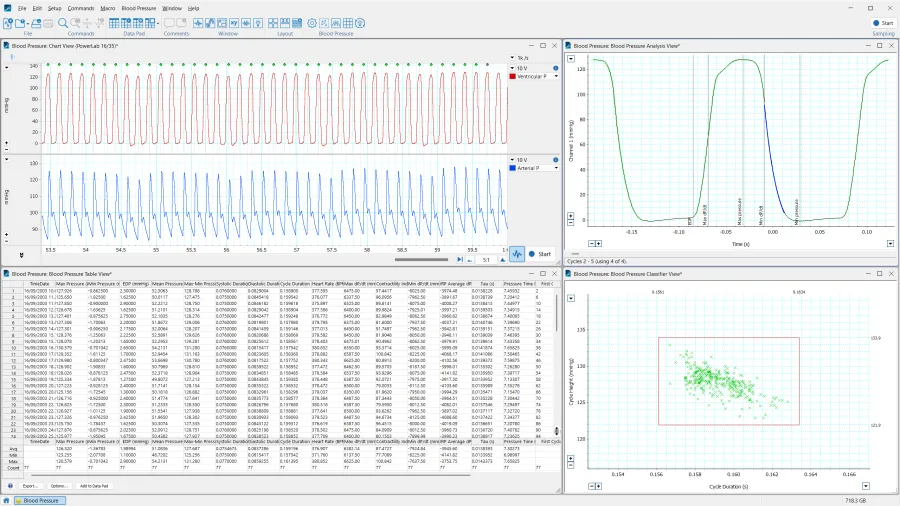
Blood Pressure
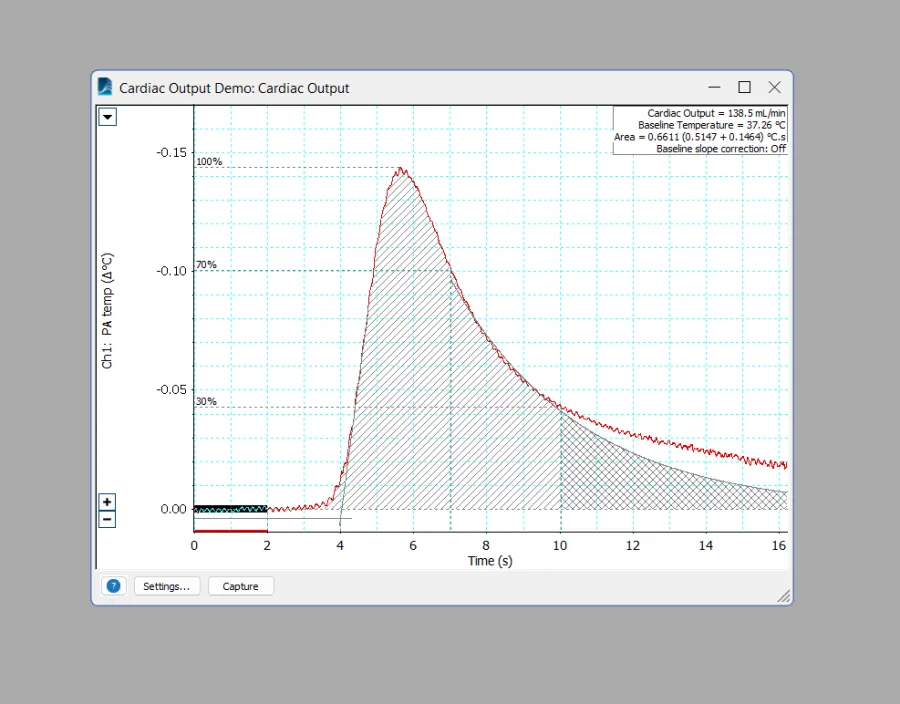
Cardiac Output
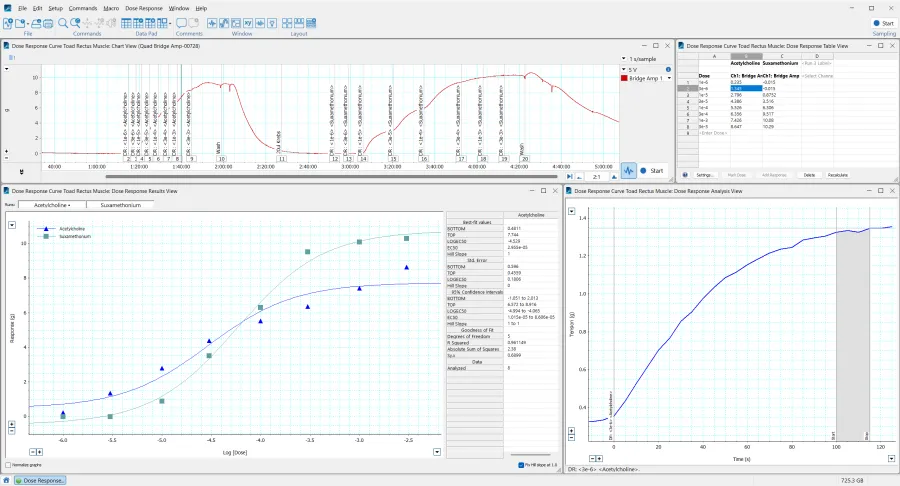
Dose Response
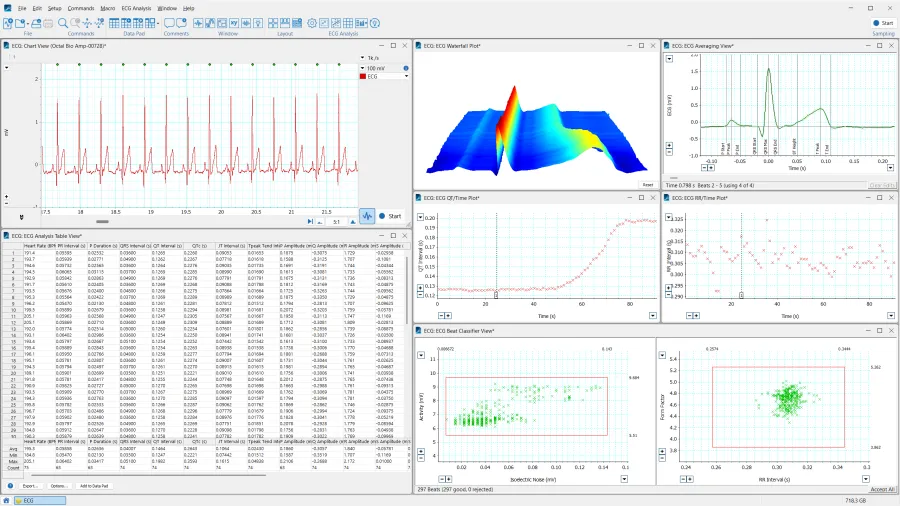
ECG Analysis
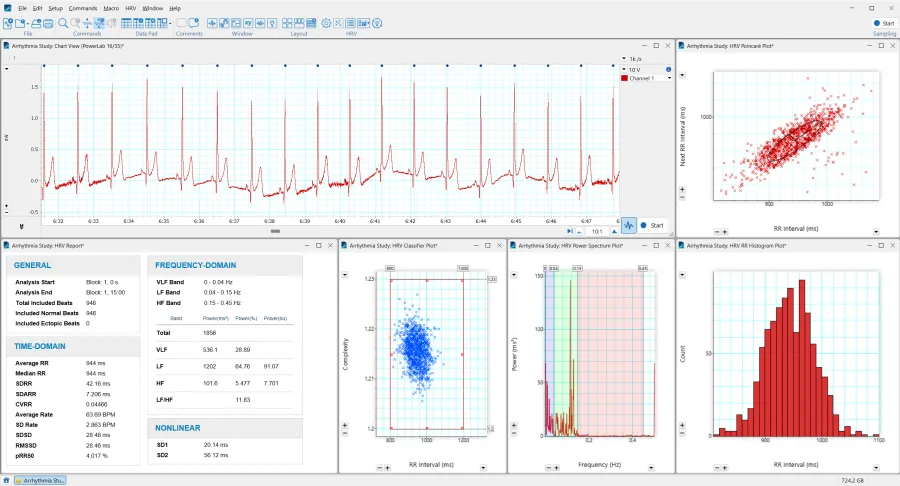
HRV
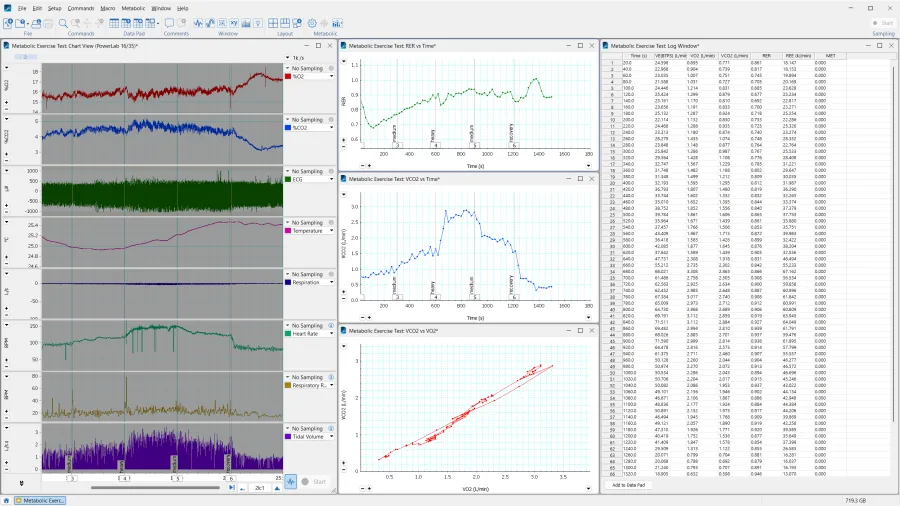
Metabolic
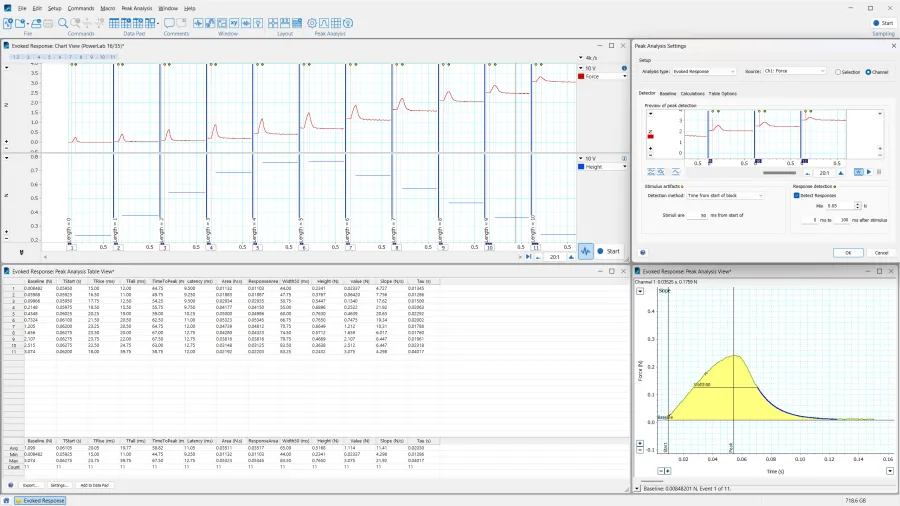
Peak Analysis
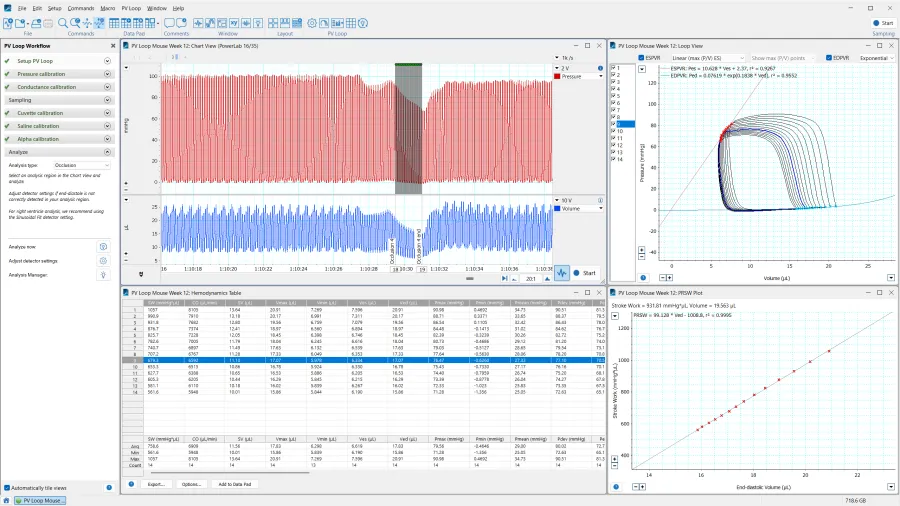
PV Loop
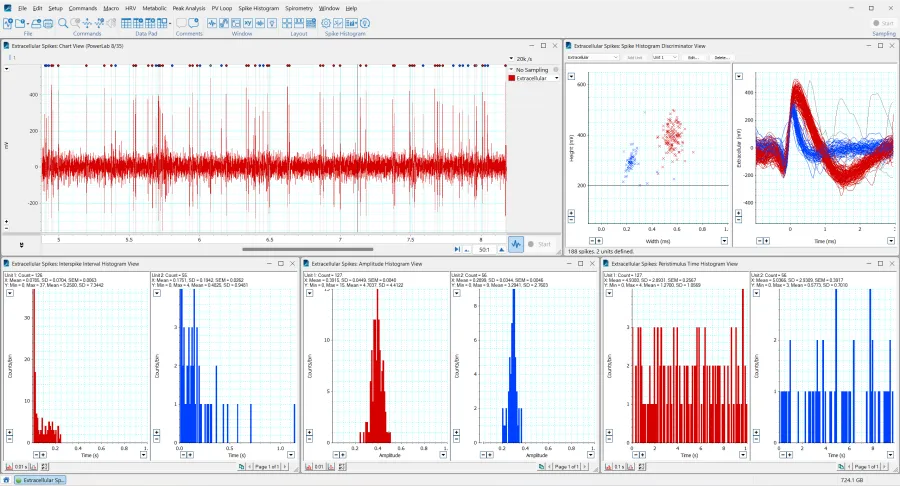
Spike Histogram
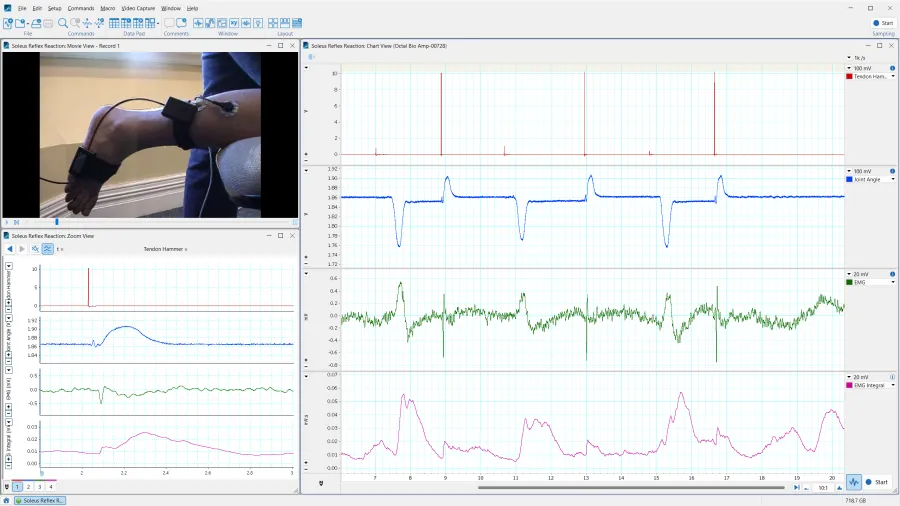
Video Capture
Expand LabChart at any time by downloading free extensions, adding new tools to your suite of data collection tools.
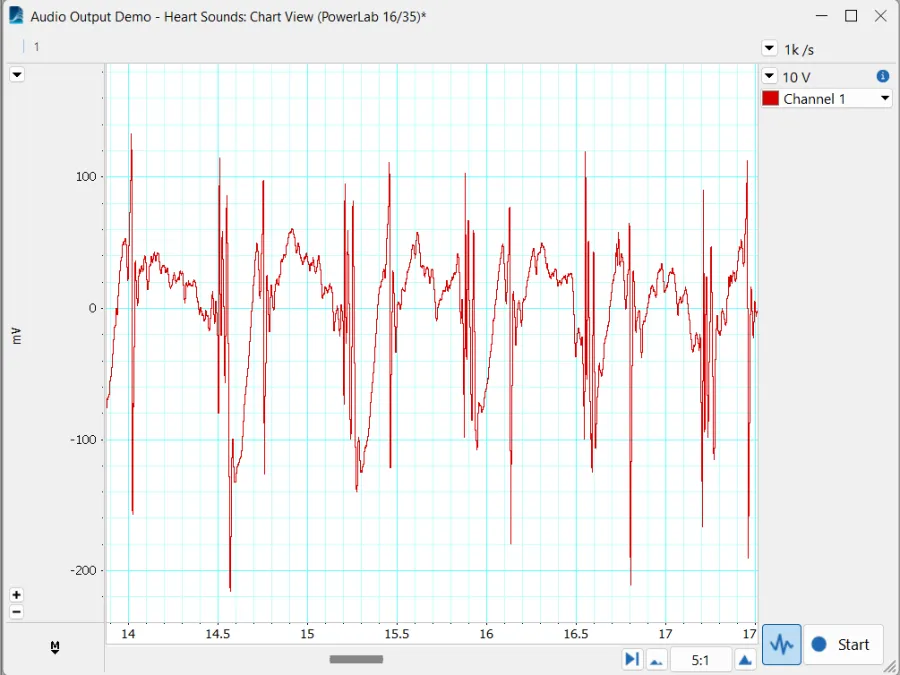
Audio Output
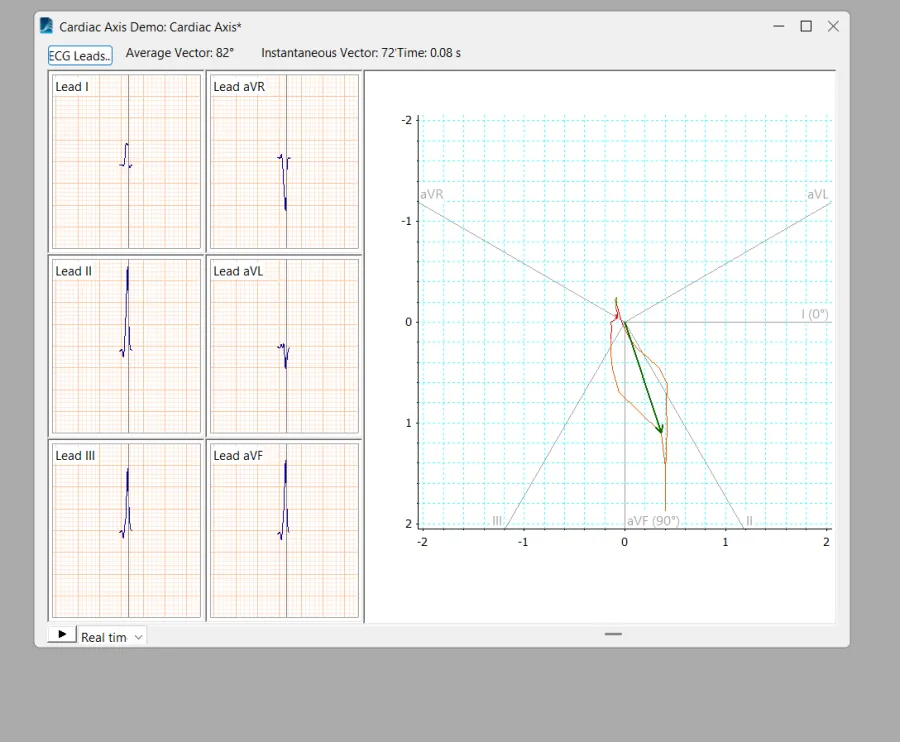
Cardiac Axis
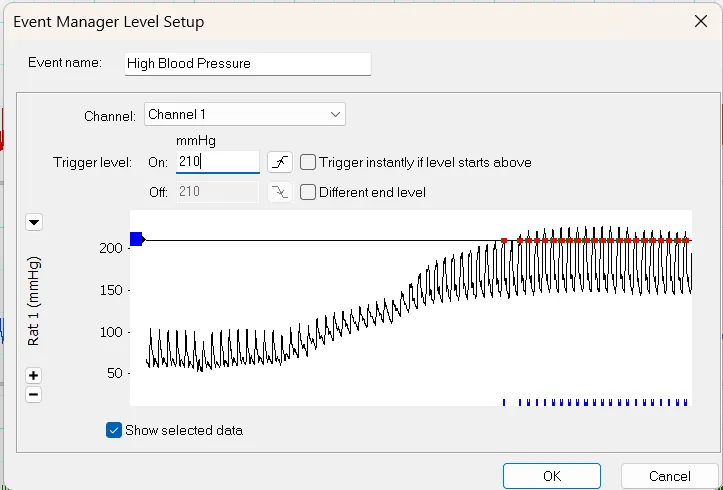
Event Manager
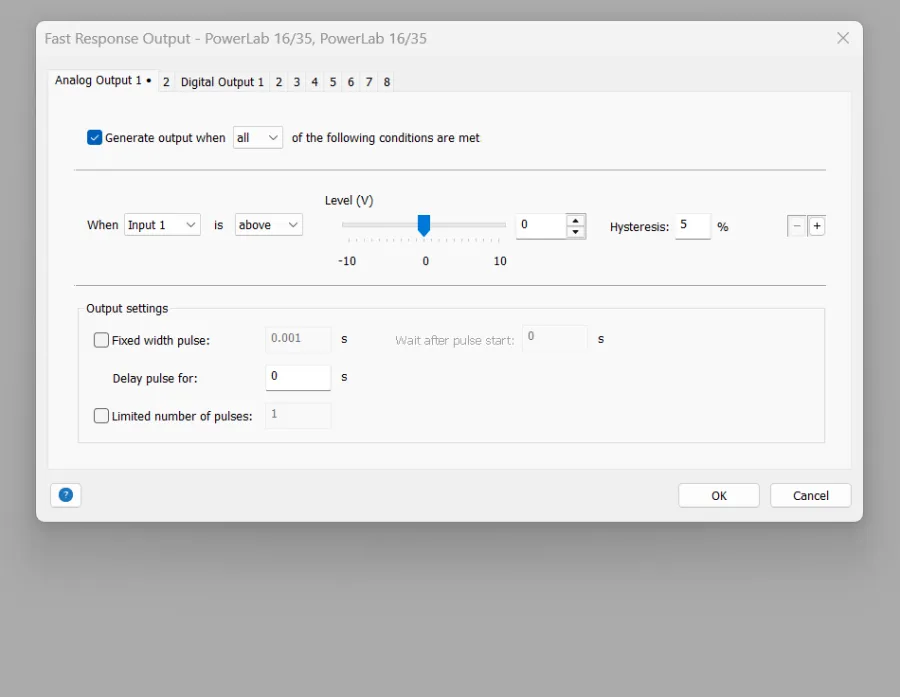
Fast Response Output
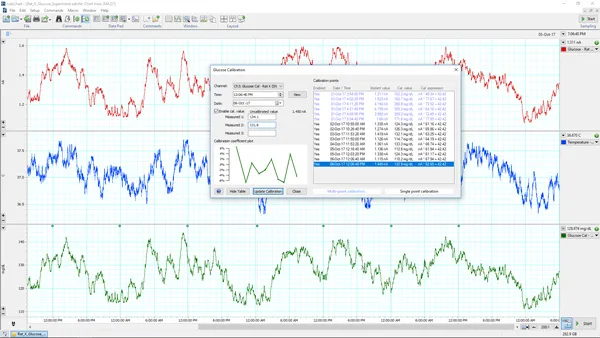
Glucose Calibration
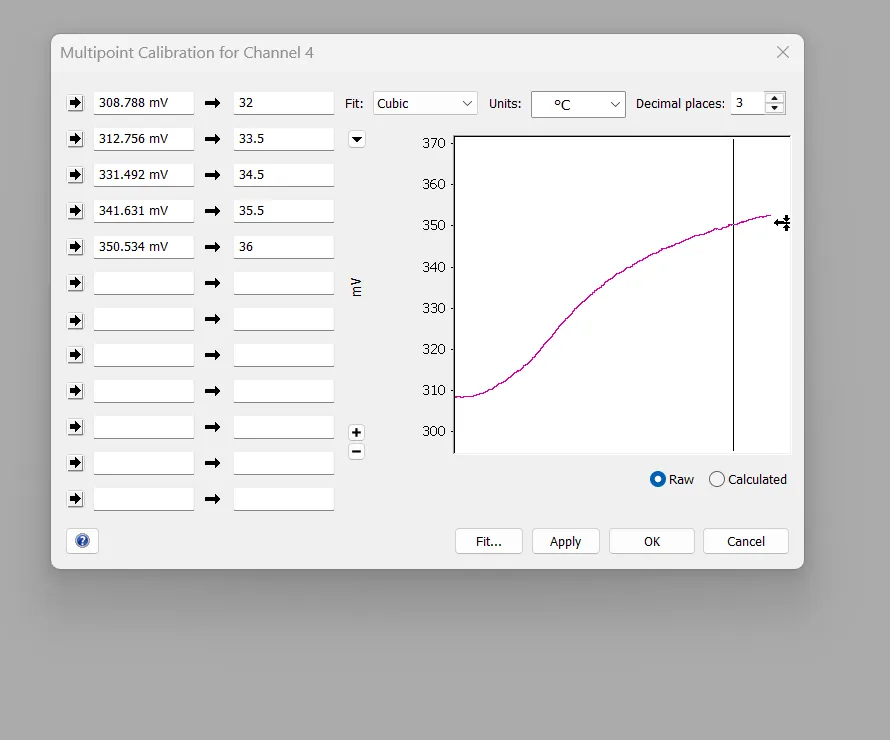
Multipoint Calibration
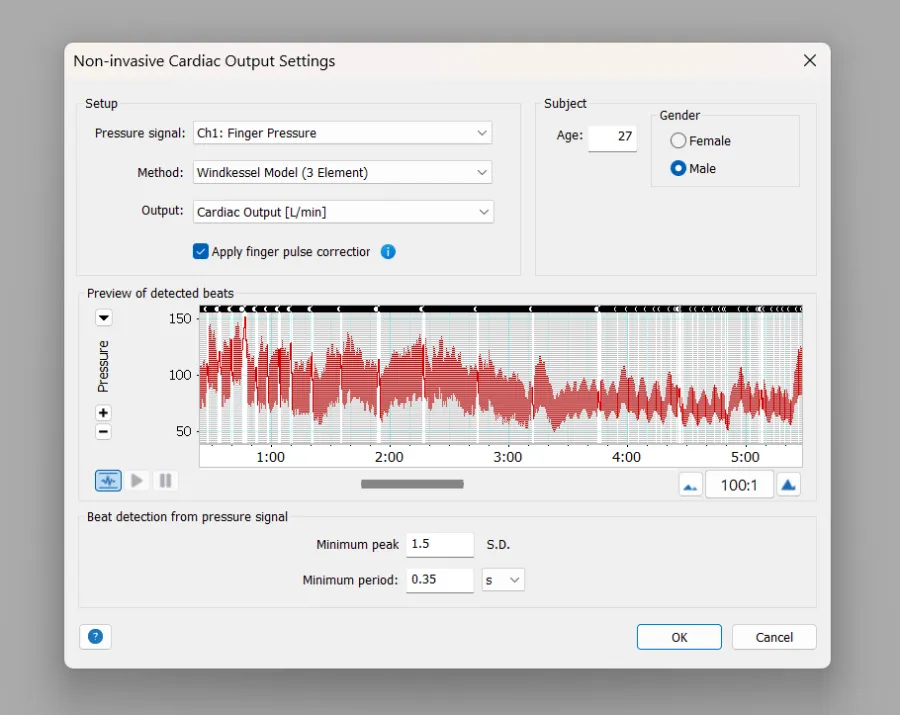
Non Invasive Cardiac Output
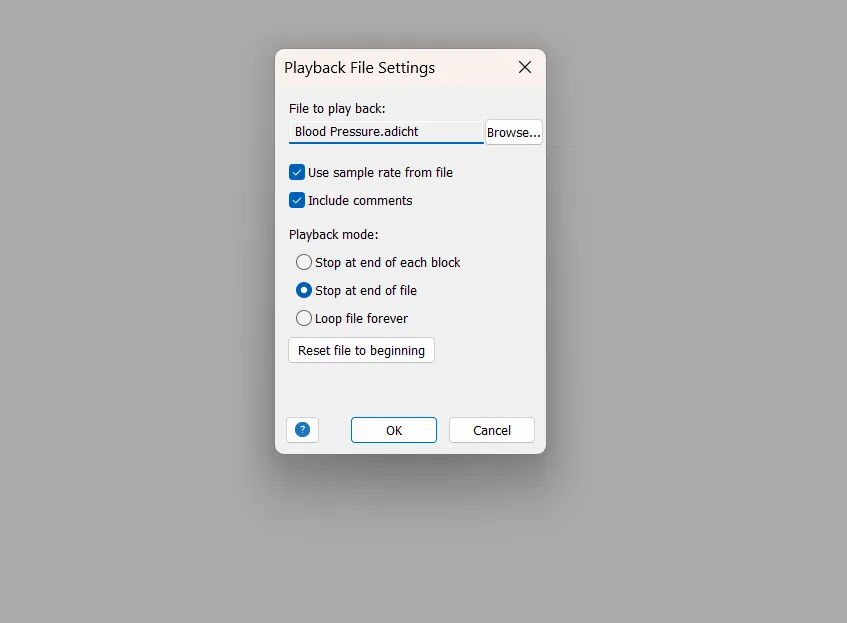
Playback File
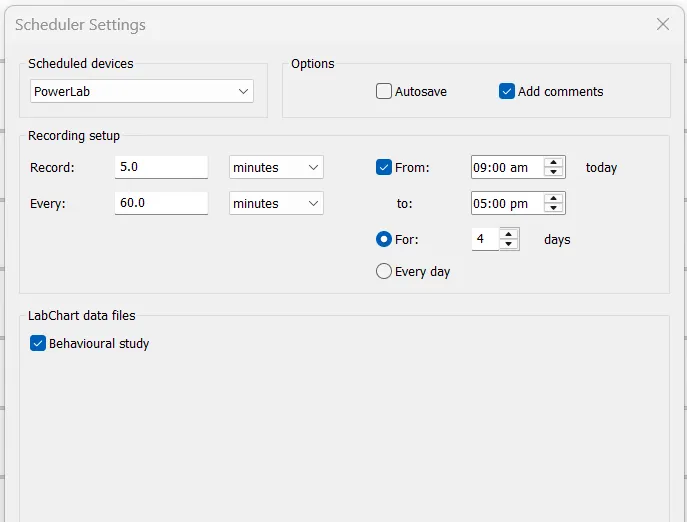
Scheduler
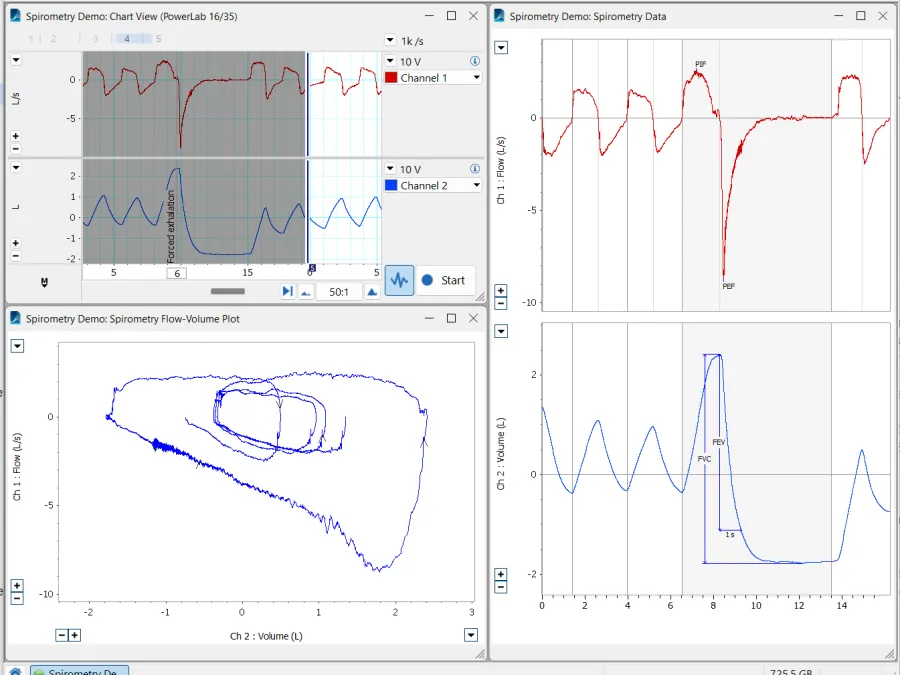
Spirometry
Streamline your hardware setup with a free download that lets you configure your hardware and record data directly into LabChart.

Blood FlowMeter Device Enabler
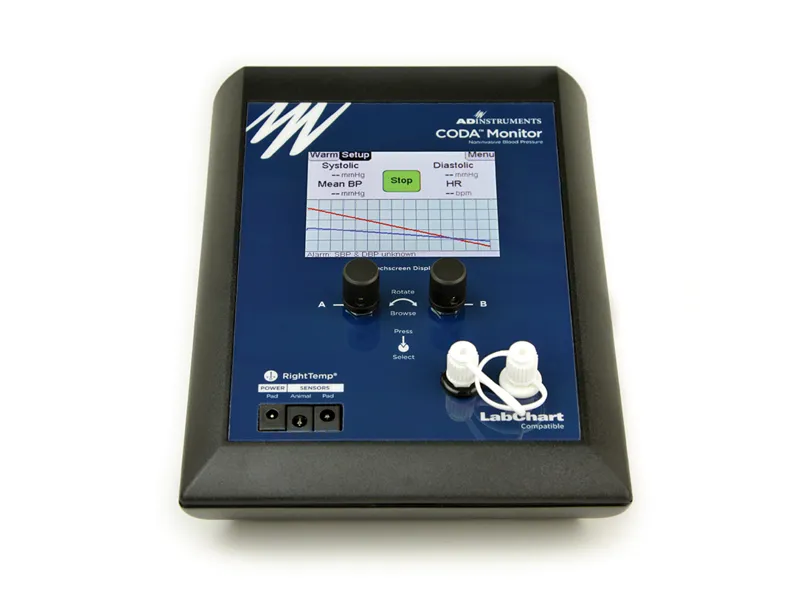
CODA® Monitor Device Enabler

DMT Device Enabler
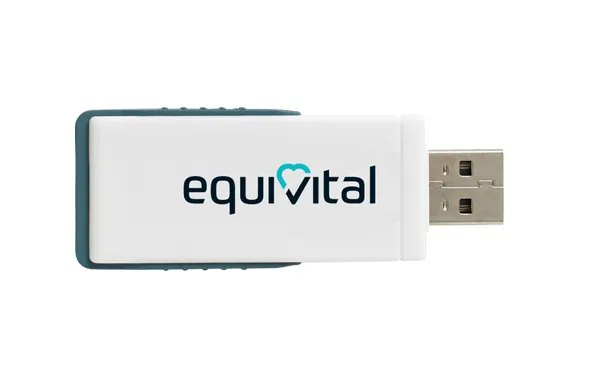
Equivital Bluetooth Dongle with LabChart Device Enabler
View Equivital Bluetooth Dongle with LabChart Device Enabler →

Human NIBP Device Enabler

Kent Device Enabler

Oxford Optronix Device Enabler
Trigno Wireless Device Enabler
Start your data acquisition journey with LabChart’s core suite of features, updated and fine-tuned over decades. These fundamental features are designed to enable clear and accurate data acquisition and analysis.
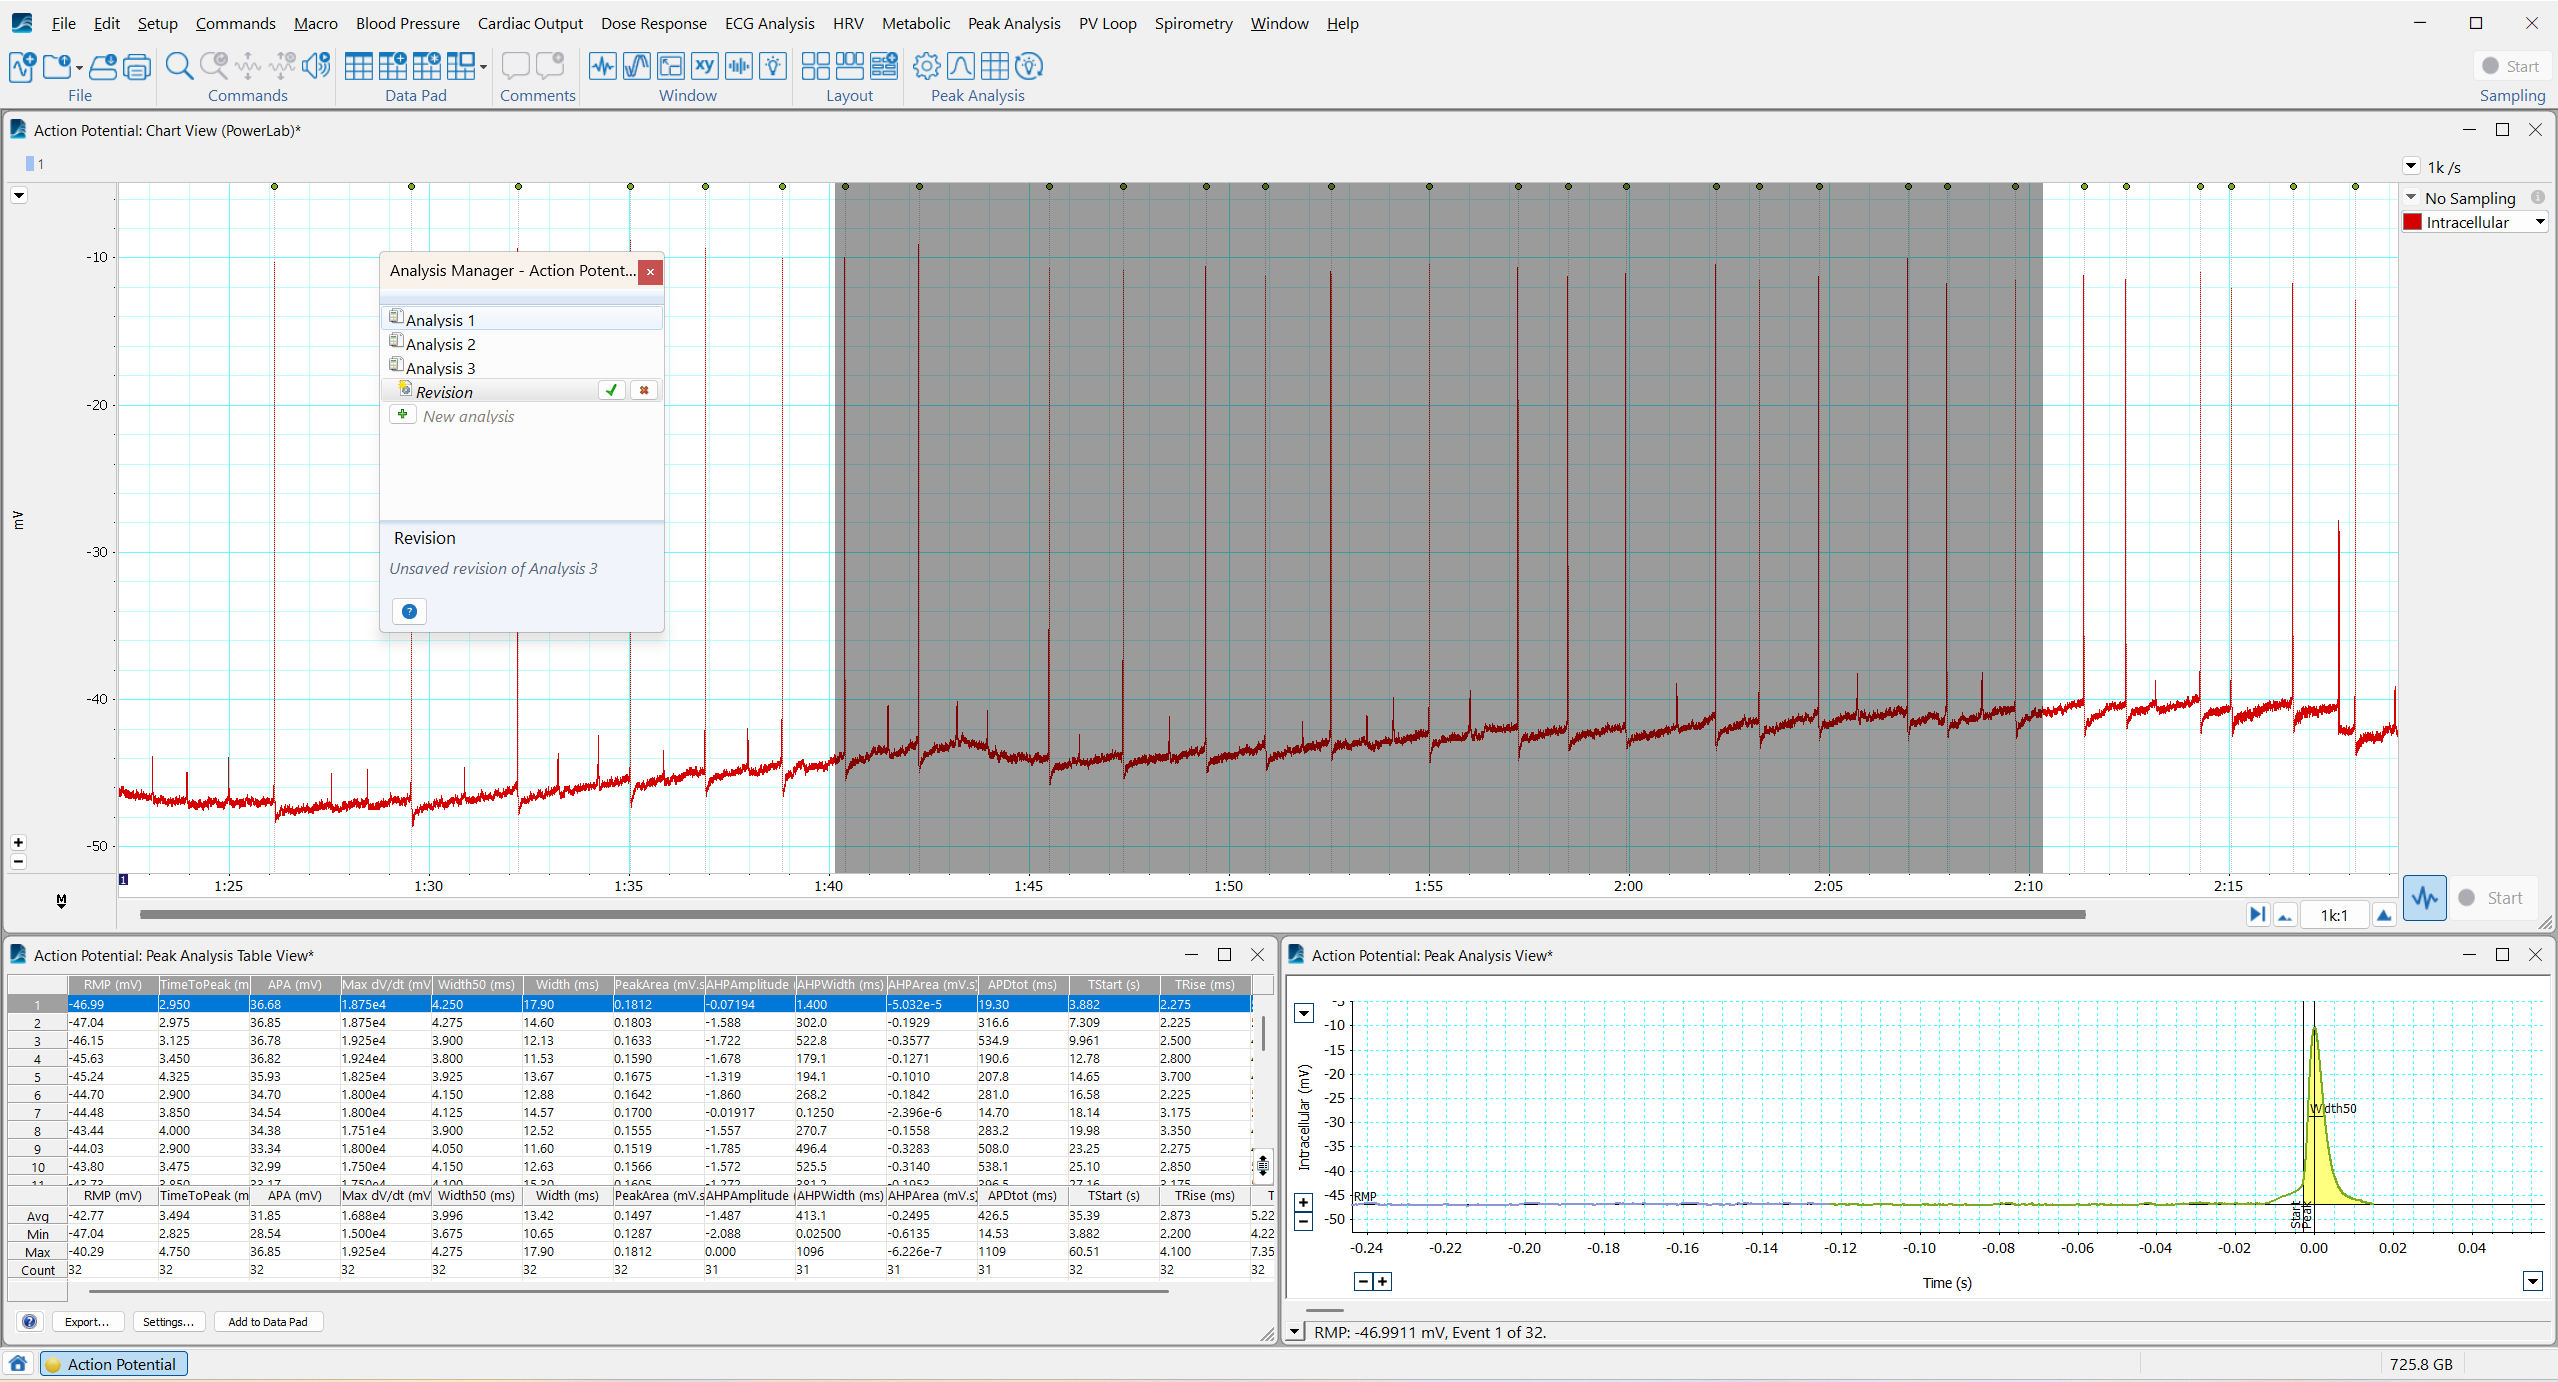
Analysis Manager
Save and label your selections and analysis regions and recall them at a click. Whether you're using an automated Analysis Module like Blood Pressure, or simply making a selection for addition to the data pad, you can recall the same selection at any time post-analysis.
Arithmetic
Our most powerful channel calculation allows you access to LabChart's calculation engine, allowing customized formulae, detection, and analysis. Take that equation direct from the textbook or article and build it within LabChart.
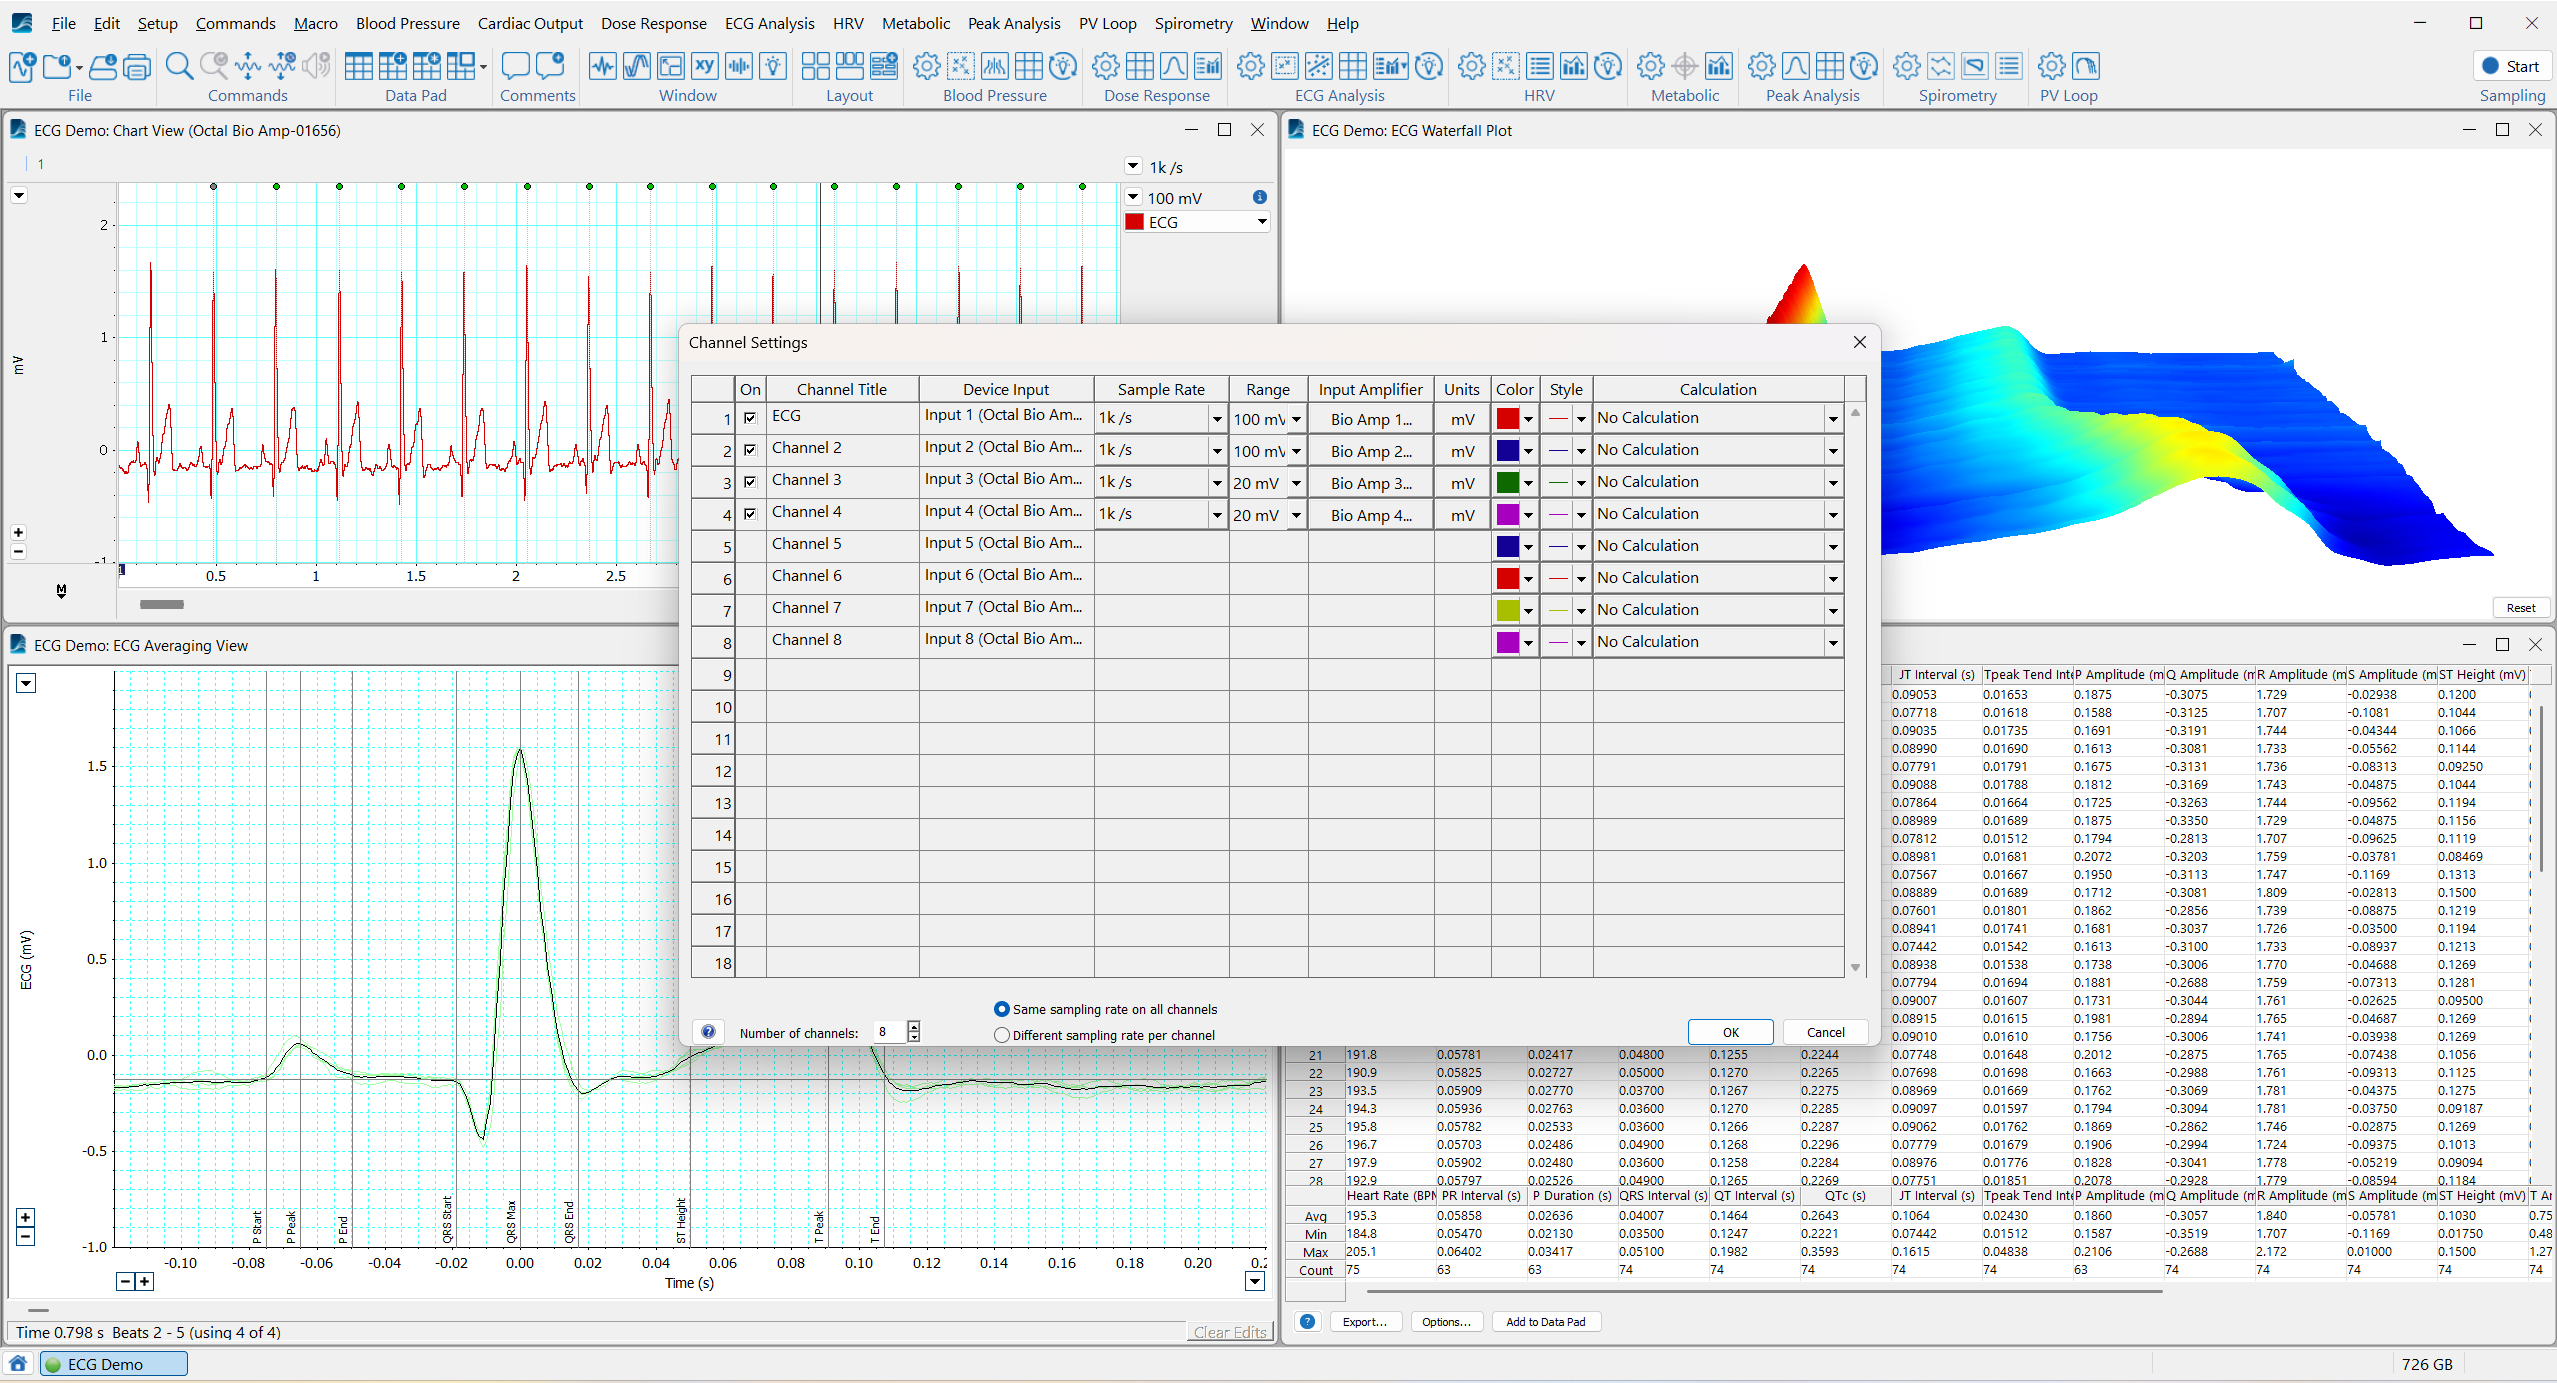
Channel Settings
The central hub of your data acquisition system provides an overview of the current recording settings, calculations and channels. Quickly change your displayed channels or add a calculation.
Comments
Annotate your data during or post acquisition to aid in navigating your traces later and use your comments to unlock the full time-saving potential of LabChart's analysis and visualization features.
Cyclic Measurements
This tool combines flexible and clever cycle detection to create a simple to use analysis for periodic waveforms. Find your Heart Rate, Systolic Pressure, Respiratory Rate, integrate a waveform over a cycle, or simply mark events.
Data Pad
The most flexible method of converting your time based raw data and calculations from the chart view to discrete values for use in statistical analysis.
Device Discovery & Devices and Channels
Find incredible flexibility in the way you acquire your signals. This dialog allows you to manage which LabChart channels will be acquiring data, and to manage from which devices and inputs that data will be provided.
DVMs
Display your raw data or calculation signals as a large numerical display. This makes it simple to see the current status of any signal from across the room. Update in real time, or display a derived calculation every 10 seconds.
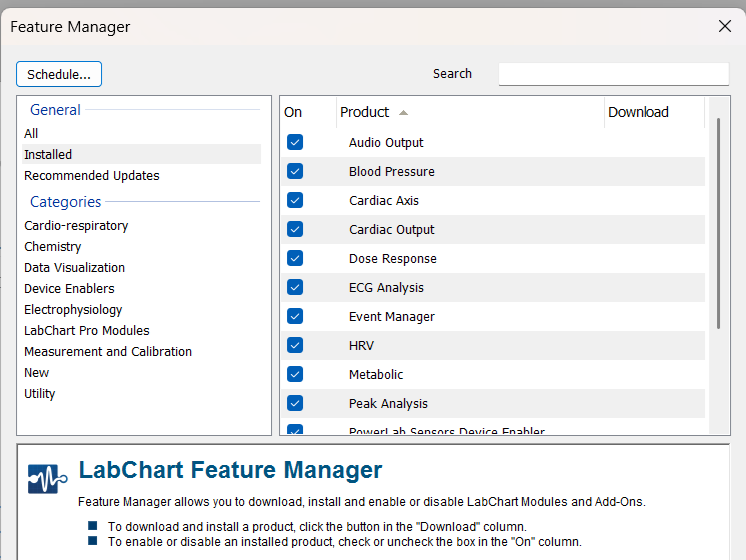
Feature Manager
Initiate your LabChart updates from within the software, search for new LabChart add-ons or toggle off features and menus you aren't planning to use for this experiment. Optimize LabChart to fit your current needs, and simplify your workflow.
Guidelines
Visualize targets for human subjects, or simply highlight a section of your data trace to ensure you'll notice when you've reached your area of interest. Guidelines provide a quick but powerful way to divide your data amplitude in to regions of interest.
Layout
Clean up your display in LabChart with this extremely convenient feature. Use Smart Tile to quickly snap all of the open windows into a neat arrangement, or save your current display and revert back to it at any time with a simple mouse click.
Macros
Record your actions for repetitive operations, or get under the hood and write custom processes in VB Script. Editable macros provide access to most of LabChart's features, your imagination is the only limitation to streamlining your workflow and processes in LabChart.
Multiple monitor support
Spread your LabChart workspace across multiple displays to keep chart view, analysis windows and reference material visible at the same time.
PowerLab Sensor Compatibility
All PowerLab and Lt Sensors are compatible with LabChart 9. If a new file is created with multiple PowerLab Sensors connected, all of the Sensors will be automatically enabled. Sampling settings, including Range and Rate, can be edited for the Sensors that have these features available.
Scope View
Display, overlay, average and analyze periodic or evoked waveforms in real time. Ideal for finding that time from stimulus to response in repeated evoked potential recordings.
Spectrum
Powerfully convert your time based signal to its component frequencies. You can display the power spectrum density, a colorful spectrogram, a channel calculation for quantifying the power in specific frequency ranges, or extract frequency parameters directly to the data pad.
Split Screen
See the chart view traces with two separate x-axis displays. View long term trends long side the latest data with this beautifully clever display feature.
Stimulator
The awesome flexibility in LabChart's stimulator dialog allows you to create a custom protocol to stimulate your preparation directly or to control an ADInstruments stimulus isolator or third-party device.
Units Conversion
Our simple two point calibration tool makes converting Voltage units to known measurement units quick and simple.
Zoom View
Take a closer look at an event, compare the timing between two overlayed channels, and export your images to publish. The Zoom View provides a snapshot of your data.