The Table, Table Question, Spreadsheet, and Spreadsheet Question panels all provide a grid layout to display text or data and support graphing capabilities. This guide helps you decide which panel best suits your lesson's needs.
Choosing the Right Panel
The ideal panel depends on your content and objectives:
- Table Panels are best for presenting rich, formatted text.
- Spreadsheet Panels are better suited for displaying and calculating numeric data.
When to Use a Table Panel
Table panels are simpler and more visually clear, making them the preferred choice unless:
- Your data includes more than five columns.
- You expect to fill many rows of data.
- Right-aligned numbers improve readability.
- The panel content needs to scroll for better navigation.
- Students need to enter and use formulas.
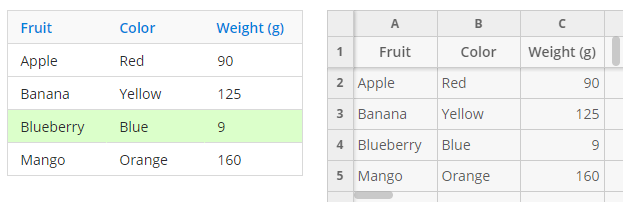
Example: The image below compares a Table panel (left) with a Spreadsheet panel (right):
Examples of Use Cases
1. Table Panel
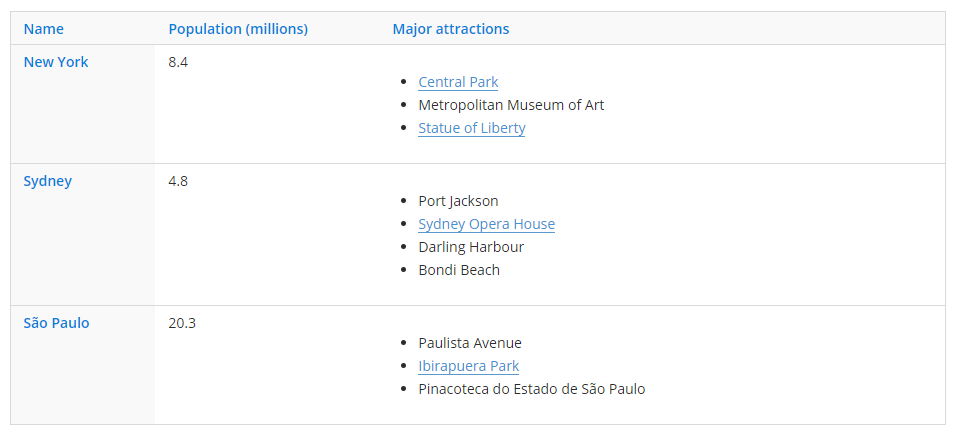
Ideal for presenting formatted text, such as comparing major cities:
2. Table Question Panel
Best for small interactive calculations, such as a BMI calculator:

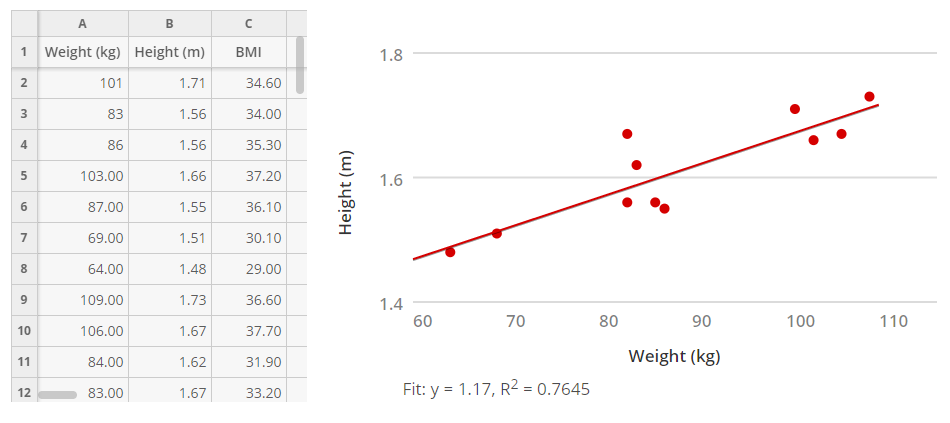
3. Spreadsheet Panel
Useful for handling larger datasets, such as creating scatter plots of weight against height:
Comparing Table and Spreadsheet Panels
As you gain experience, you’ll quickly determine which panel fits your needs. Below is a summary of the key differences:
| Table | Spreadsheet | |
|---|---|---|
| Purpose | For tables of formatted text | For calculating and displaying numbers |
| Text formatting | Yes, rich text, including paragraphs, lists, bold, and italic formatting | No; plain text only |
| Cell formatting | Yes, colors and headings | Headings only |
| Maximum columns | 40 | 26 (A–Z) |
| Cell height | Automatically grows with content of cell | Fixed; extra cell content is hidden |
| Text alignment | No text alignment | Automatic right-alignment of numbers |
| Formulae | Yes, for Table Question only | Yes |
| Graphing | Yes | Yes |
| Student editing | Yes, the Table Question panel allows students to edit | Yes, the Spreadsheet Question panel allows students to edit |
| Student can enter formulae | Yes, the Table Question panel allows students to enter formulae | Yes, the Spreadsheet Question panel allows students to enter formulae |
| Panel scrolling | None; the table is as tall as required by the content | Panel content scrolls within height set by author |