Ventricular Pressure Volume + PV Loops
The gold-standard for measuring direct, real-time, complete cardiac function.
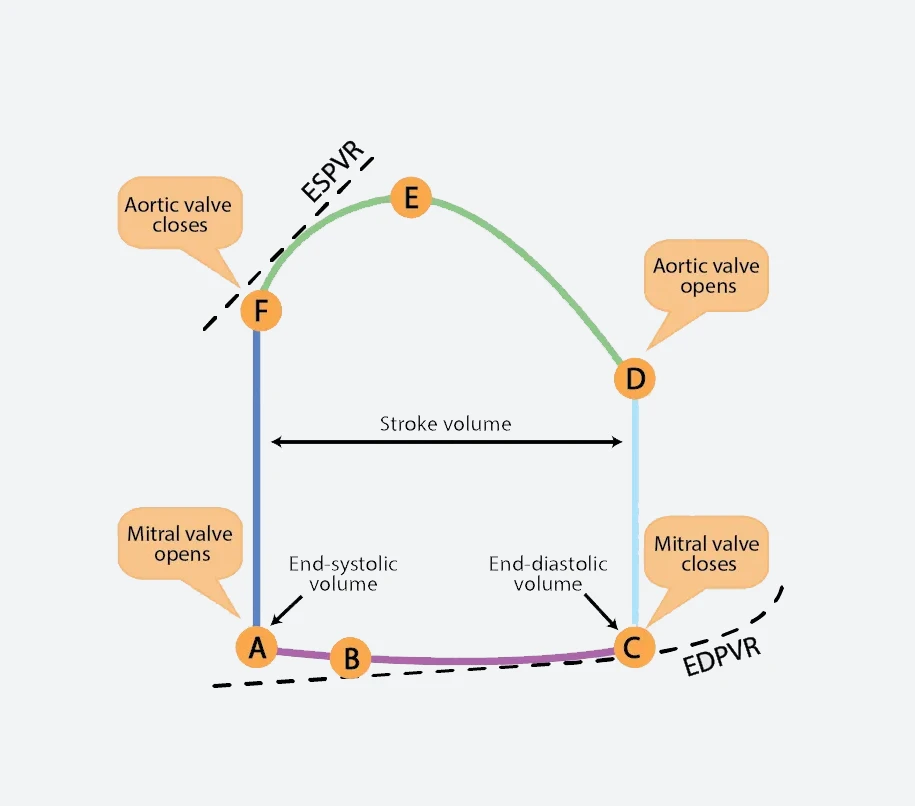
Ventricular Pressure Volume Loops (PV Loops) provide direct, real-time data about load-independent cardiac function.
Combine Millar Mikro-Tip pressure-volume catheters with the MPVS Duo, PowerLab, and LabChart for precise calibration, acquisition, and analysis of beat-to-beat cardiac performance.
Advantages of PV Loop Research
Load-Independent Cardiac Performance – Get a true measure of beat-to-beat cardiac output without the influence of preload or afterload.
Continuous Recording – Measure pressure and volume continuously throughout the cardiac cycle.
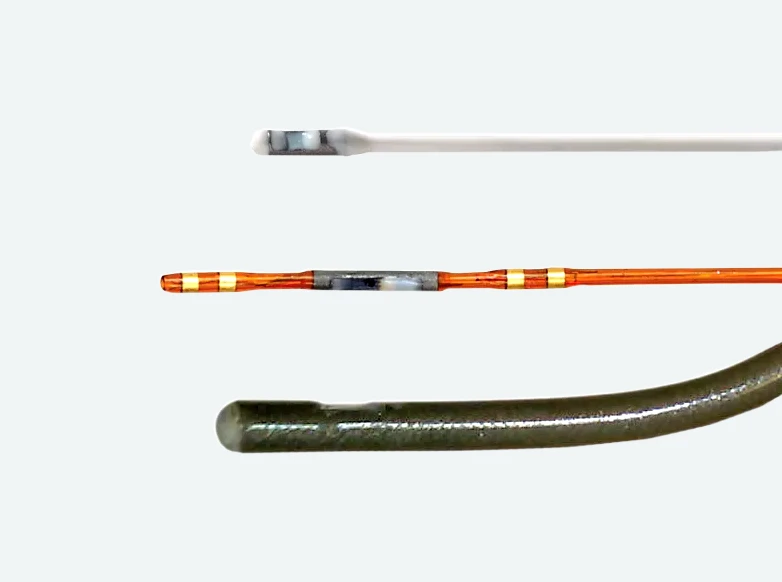
Direct Pressure Measurement – Record pressure directly from the ventricle using Millar Mikro-Tip solid-state catheters.
Clear Impacts of Disease – Observe the true load-independent impacts of diseases like aortic and mitral stenosis on the performance of the heart.
Typical Studies
- Systolic and diastolic dysfunction
- Pulmonary hypertension
- Cardiac hypertrophy
- Cardiac failure
- Cardiovascular remodelling and vascular occlusions
- Pharmacology / toxicology studies
- Transgenic manipulation
- Ischemia / Reperfusion studies
- Gene manipulations
- Cardiac resynchronization therapy
- Surgical interventions


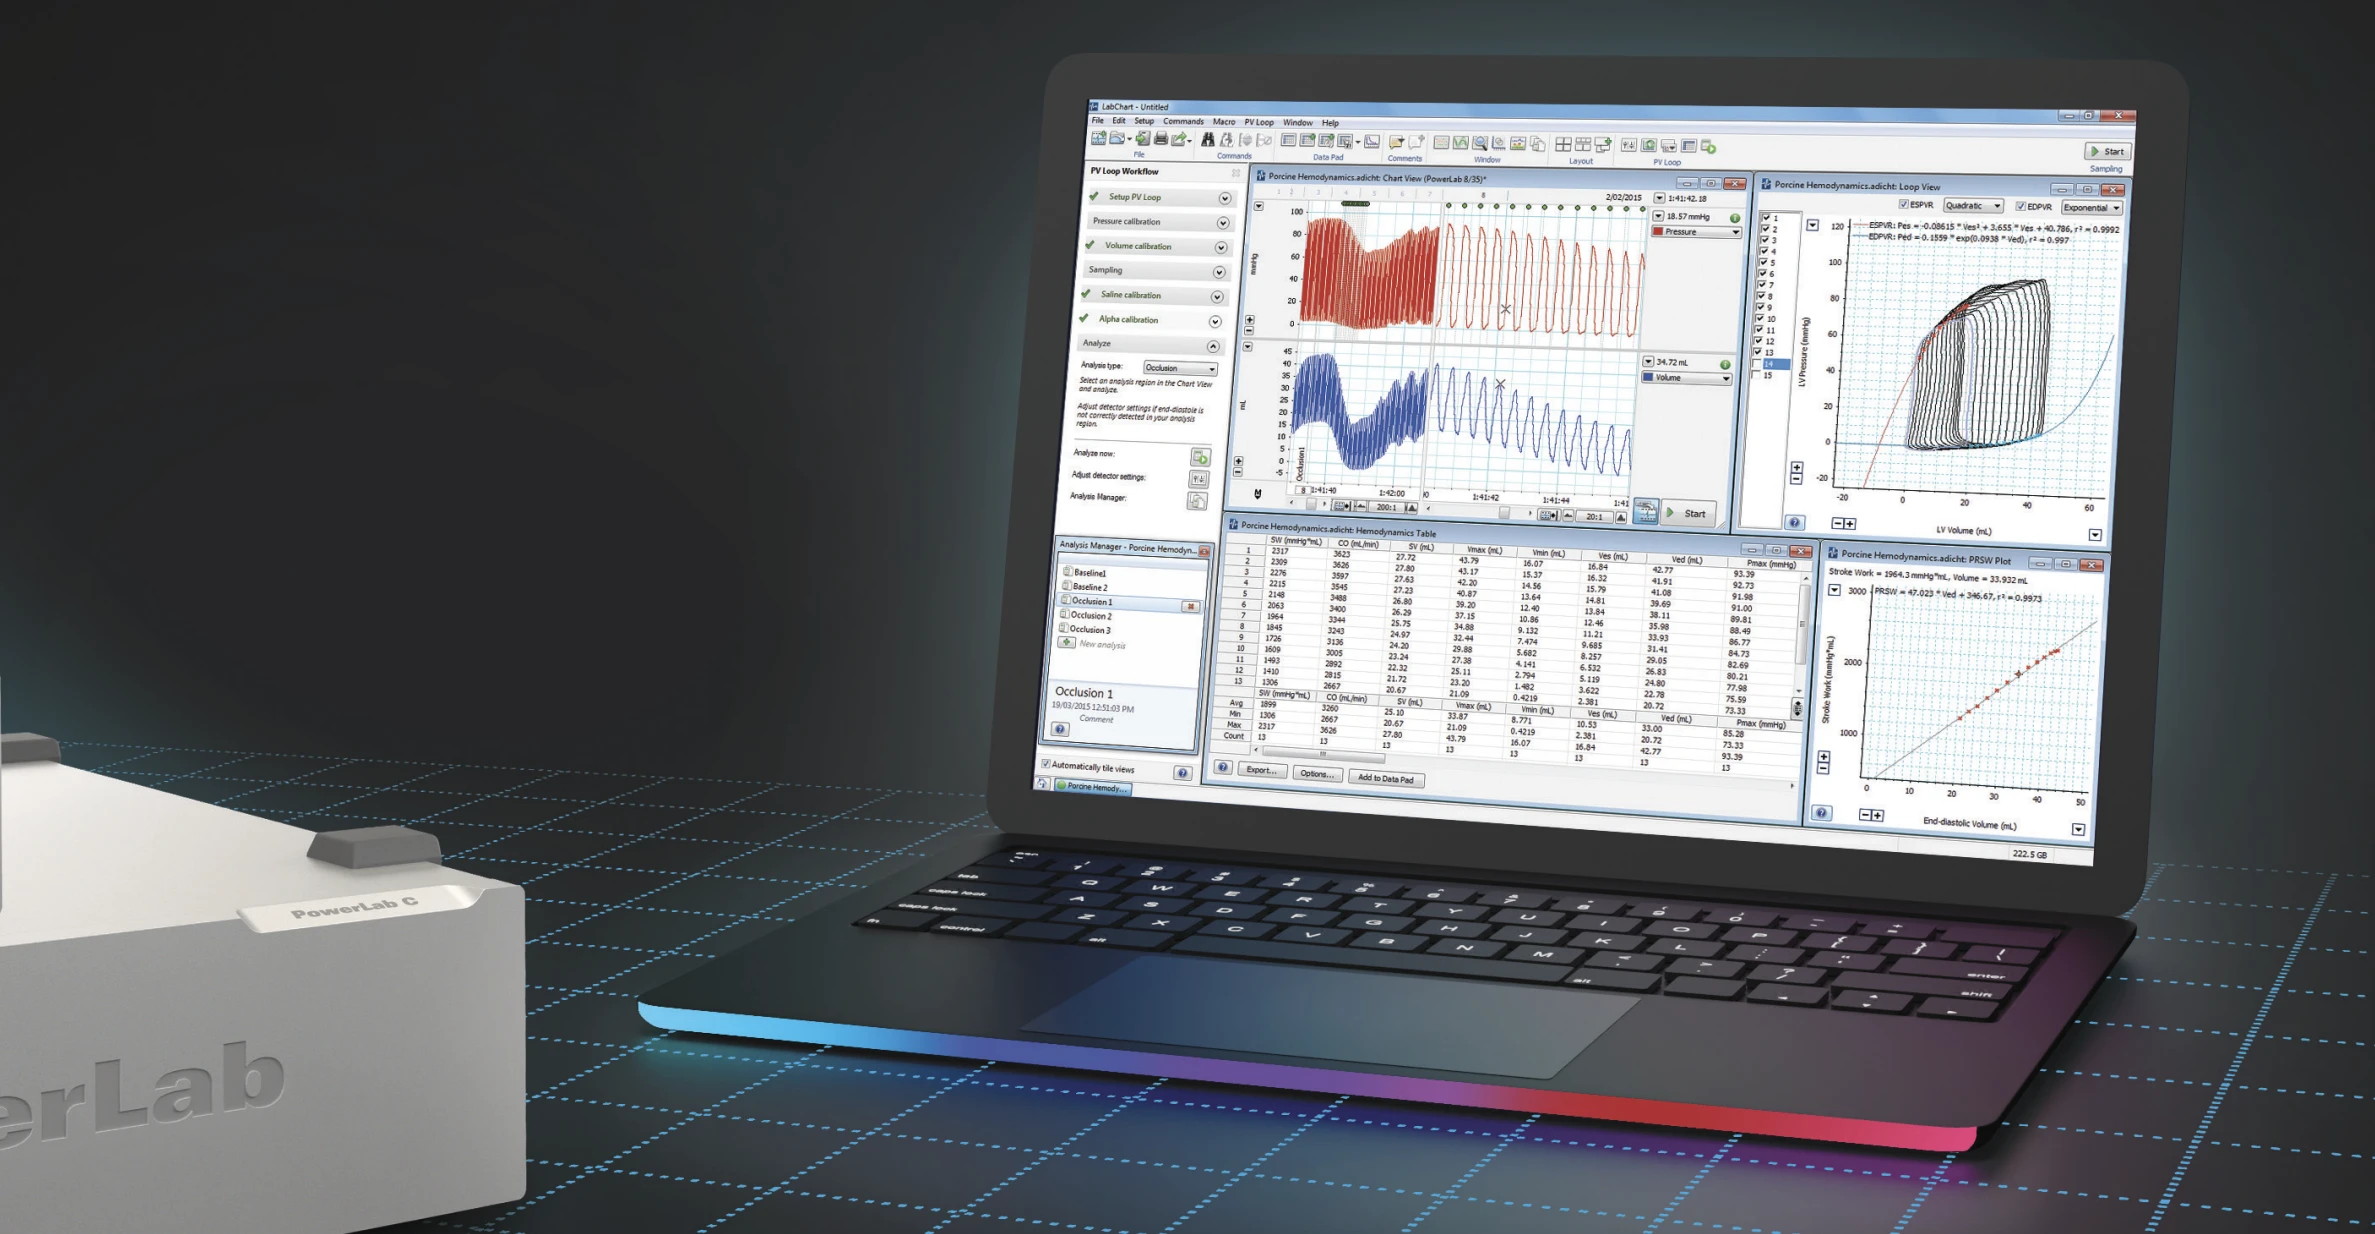
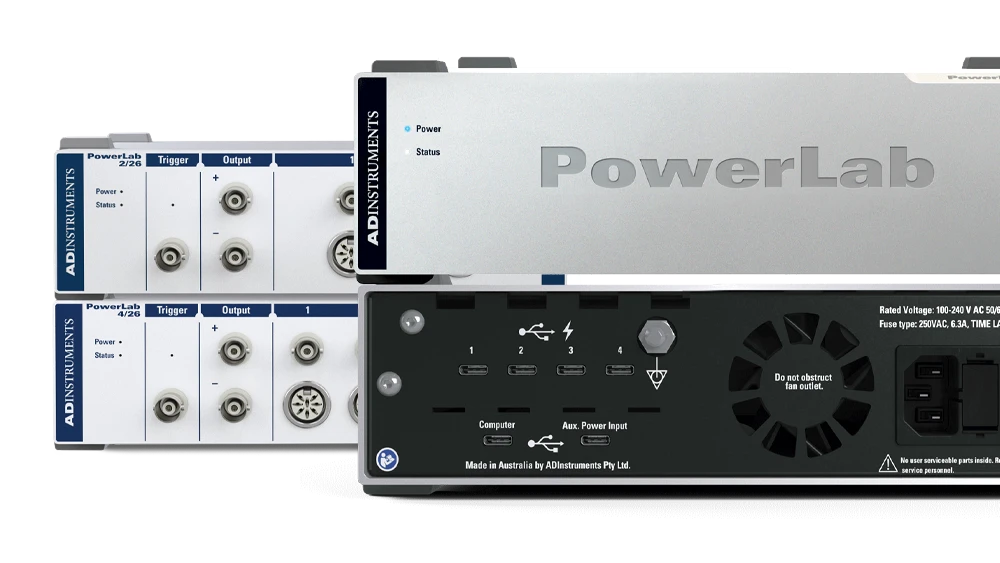
ADInstruments and Millar PV Loop System
![]()
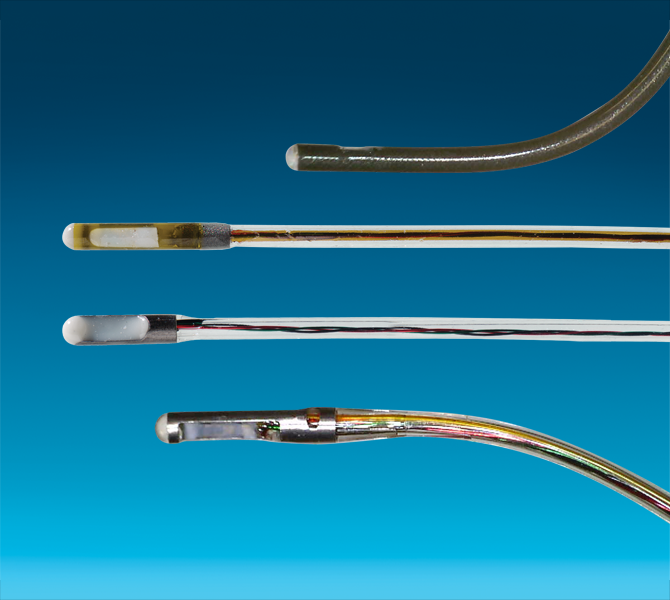
Precision Pressure Monitoring
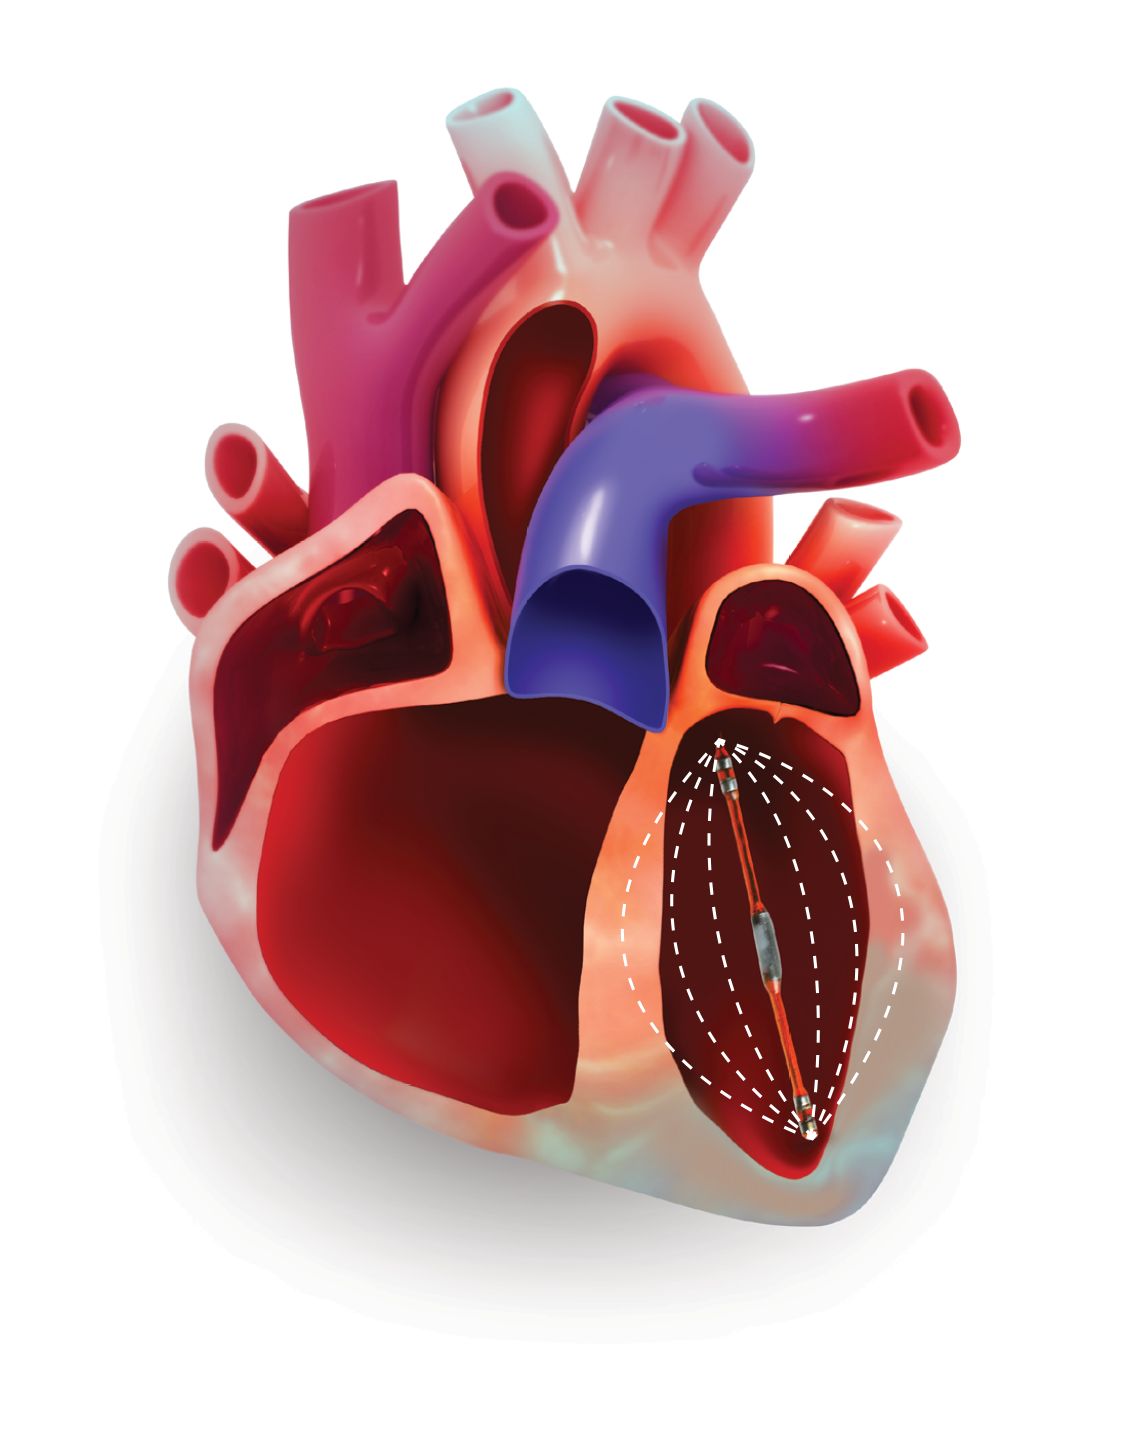
Millar Mikro-Tip solid state pressure volume catheters measure directly from the ventricle, producing sharper, cleaner pressure waveform recordings without the signal attenuation of a fluid-filled catheter.
![]()
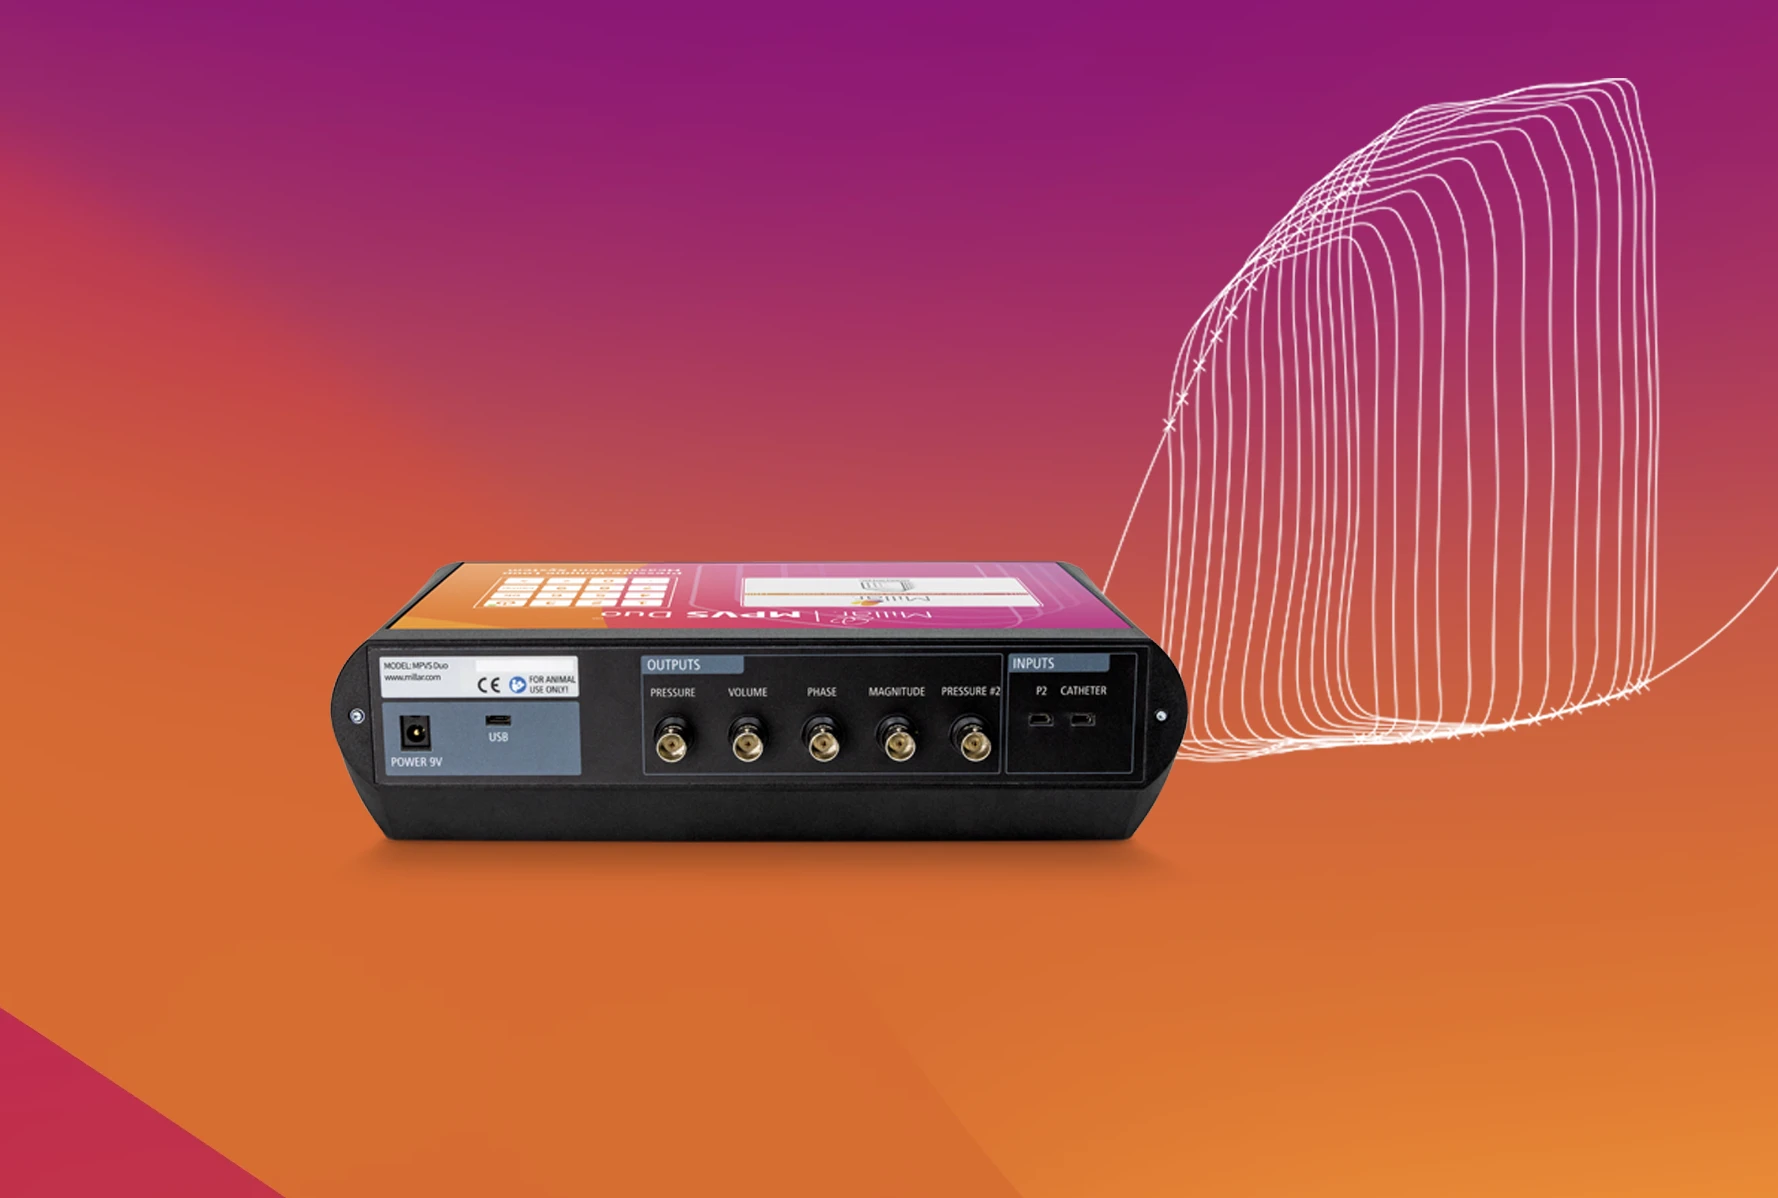
Freedom to Choose Your Calibration Method
With both Admittance and Conductance supported by the MPVS Duo, LabChart, and Millar catheters, you can perform PV Loops reliably exactly the way you want to.
![]()
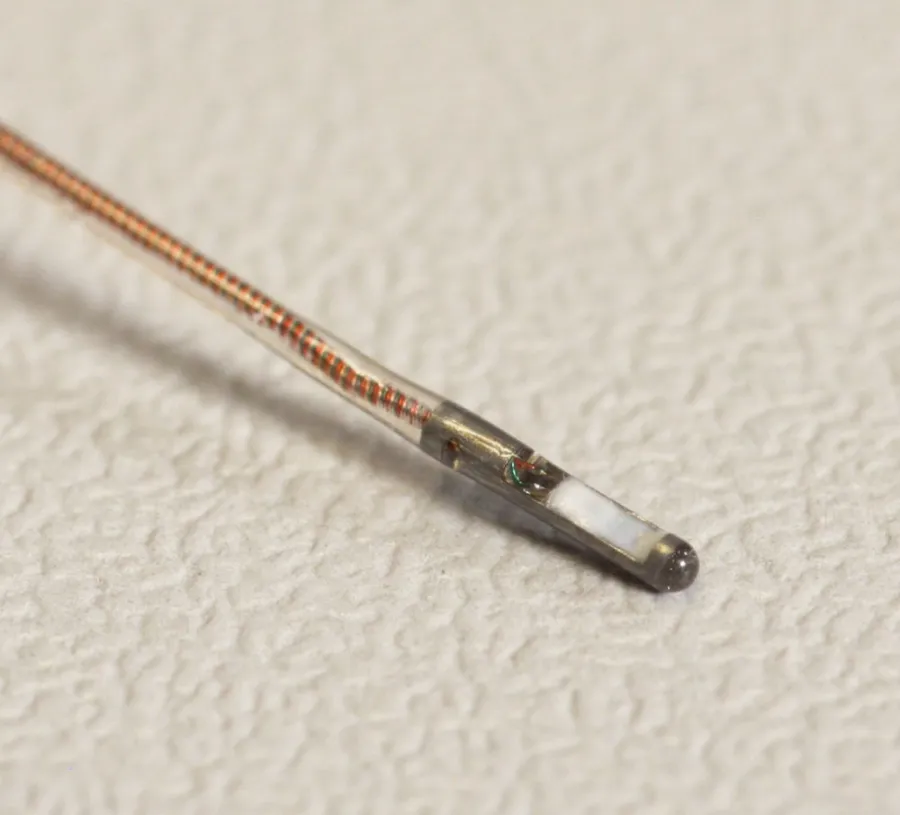
Designed For All Animal Models - Big And Small
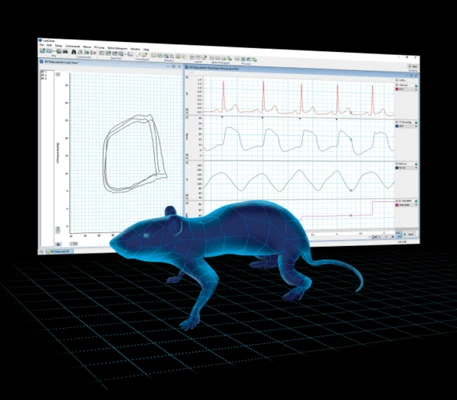
Your animal models may change, but your technology doesn’t need to. Whether you’re working with tiny rodents, large ovines, or any model in between; The MPVS Duo, LabChart, and PowerLab keep your data acquisition processes constant. Simply swap in the properly sized catheter to your existing system and run your standardized process. A consistent system keeps complications to a minimum.
![]()
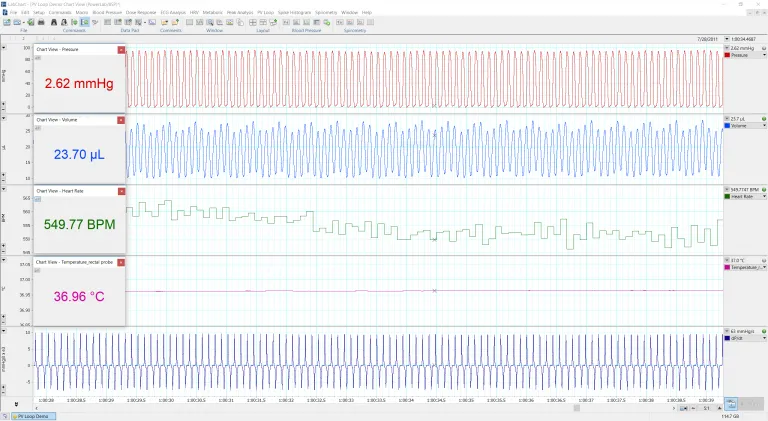
Real-Time Positioning Feedback
Nothing is more important to your PV Loop data than catheter positioning inside the ventricle. With real-time feedback, the MPVS Duo and LabChart dramatically reduce catheter positioning time and give you greater confidence in your data.
![]()
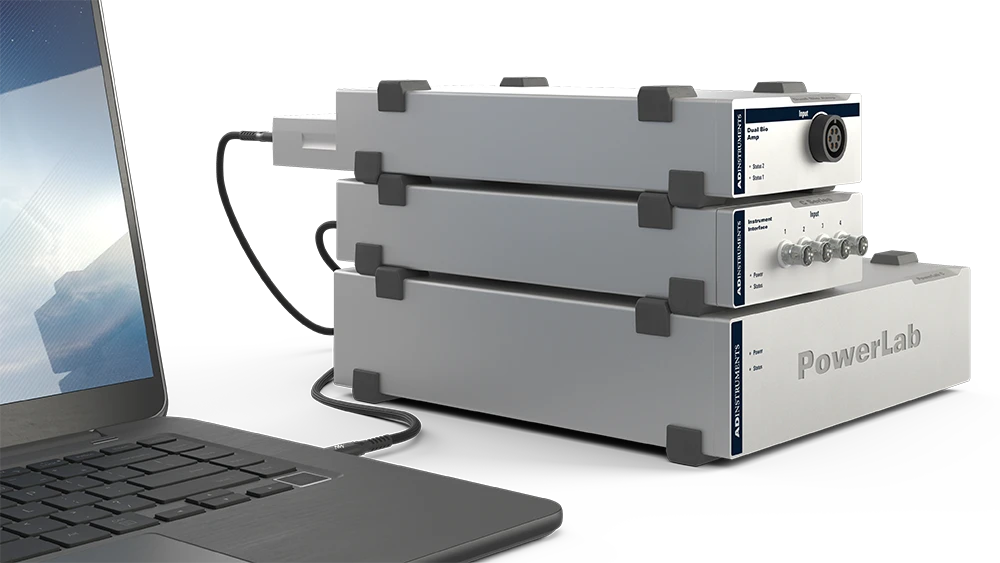
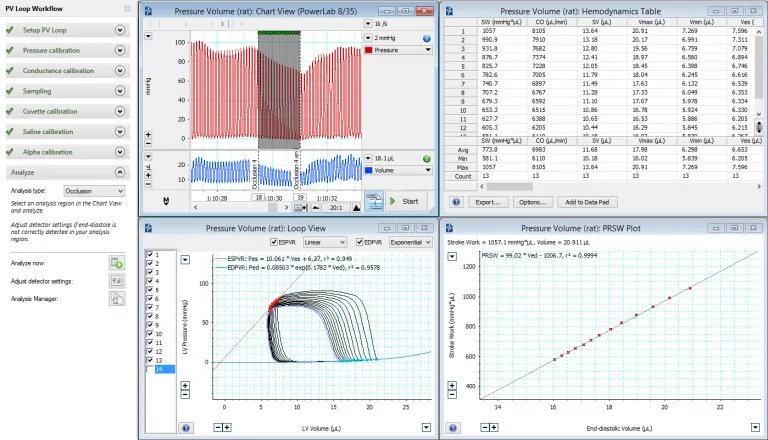
Seamless Integration
Millar pressure-volume catheters and MPVS Duo hardware effortlessly integrate with the ADInstruments’ LabChart PV Loop Module, getting your experiment up and running quickly within an all-inclusive analysis system.
![]()
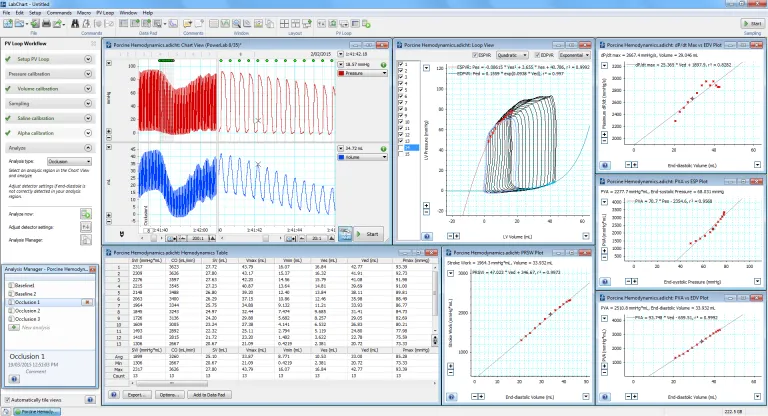
Standardized Experimental Processes
Reliable and consistent experimental processes are key to reproducibility. The MPVS Duo and LabChart PV Loop Module combine to build a PV Loop workflow that is consistent across experiments, animal models, and labs - facilitating generalizability with the wider PV Loop literature.
Configure a System for Mouse PV Loops
Configure a System for Rat PV Loops
Configure a System for Large Animal PV Loops


Real Results in Research

Dr. Pedro Ferreira
University of Porto
Measurement of Cardiac Function Using Pressure-Volume Loops in Swine


Dr Dimitrios Georgakopoulos
Swinburne University of Technology
Understanding Ventricular Pressure-Volume Catheter Calibrations and Experimental Design

Citations
PV Loops have been tested and validated as an accurate method of cardiovascular research.


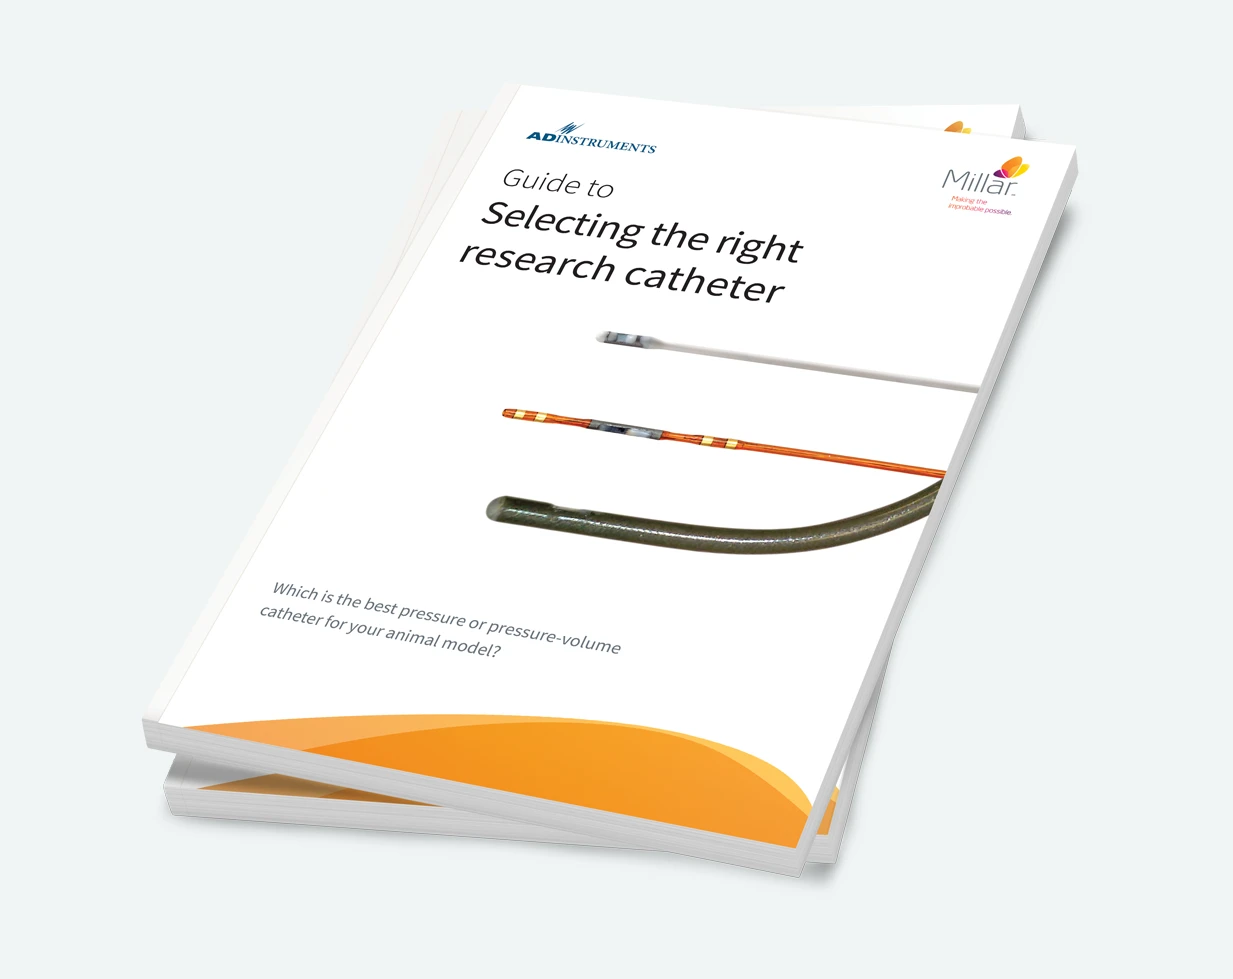

Manuals, Brochures, FAQ, Setup
Browse our technical pressure-volume catheter information to learn about best practices and get an idea of how to use PV Loops in your research.
Best Practice and Guides
Setup Videos
How could beat-to-beat pressure volume loops transform your research?
Talk to our team
Want more? See our Resources for PV Loop Research »
Flexible Data Acquisition and Analysis
Millar Mikro-Tip Pressure Volume catheters integrate with the MPVS Duo, PowerLab, and LabChart for precise cardiovascular data acquisition and analysis.
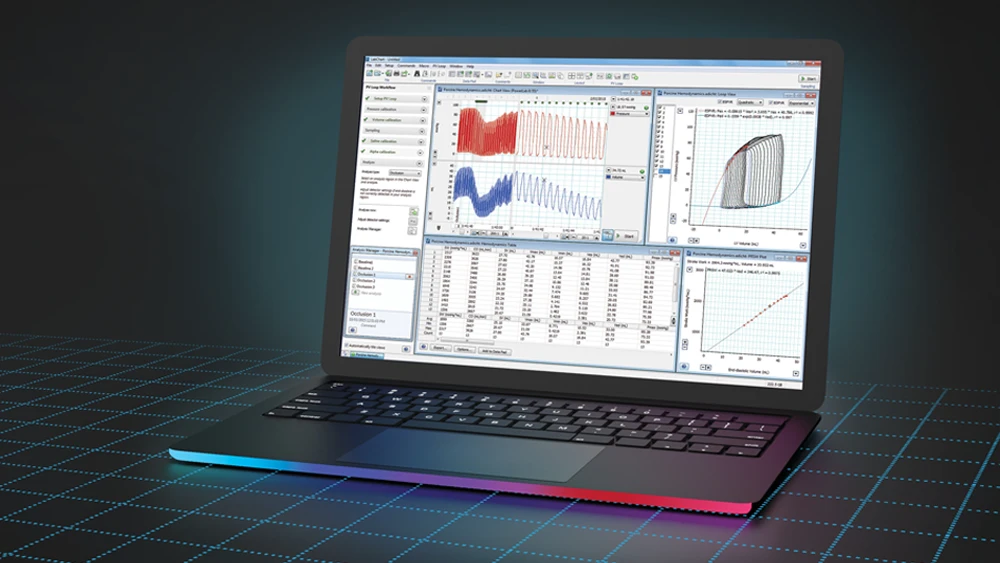
All your analysis in one place
LabChart software is designed specifically for life science data and provides up to 32 channels for data display and analysis options that are powerful and easy to use. With auto-recognition of ADI and LabChart Compatible hardware, multi-window views, one touch recording, simultaneous recording from multiple devices, specialized preconfigured settings, easy sharing options and an interface that can be customized to show only the features you want to use.
Related Add-Ons

Save and label your selections and analysis regions and recall them at a click. Whether you're using an automated Analysis Module like Blood Pressure, or simply making a selection for addition to the data pad, you can recall the same selection at any time post-analysis.