Ventricular Pressure Volume + PV Loops
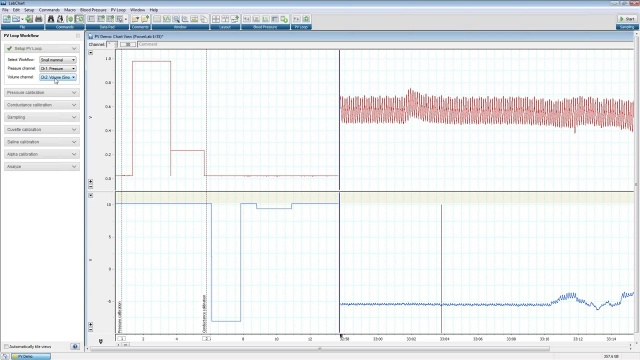
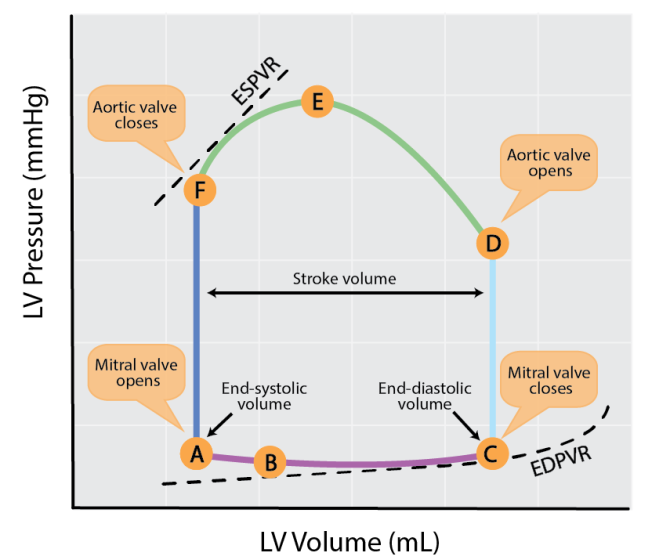
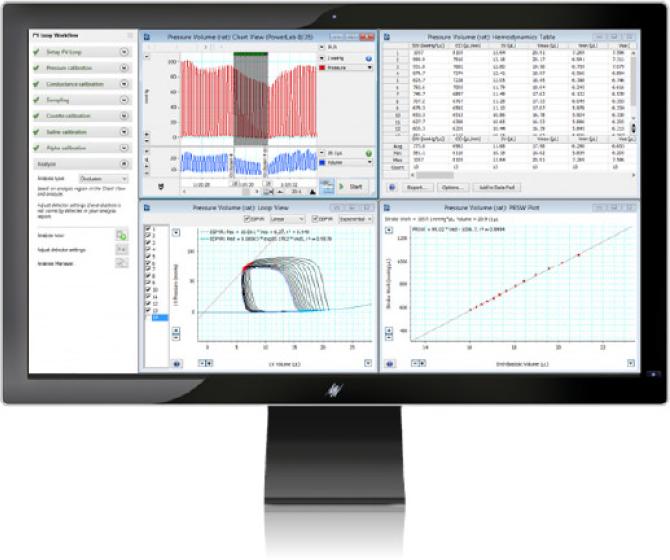
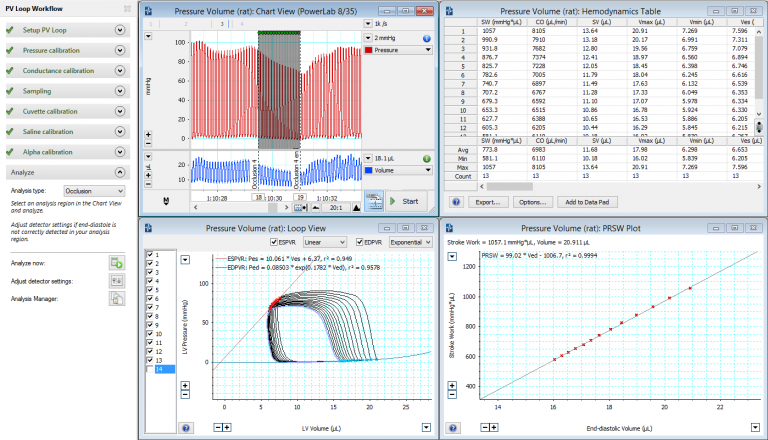
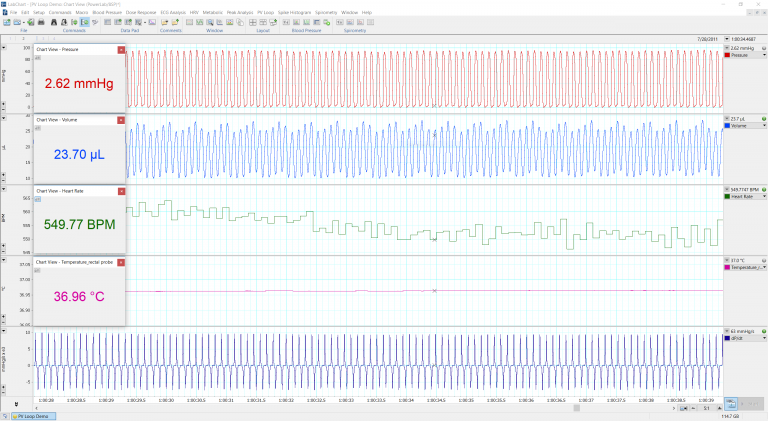
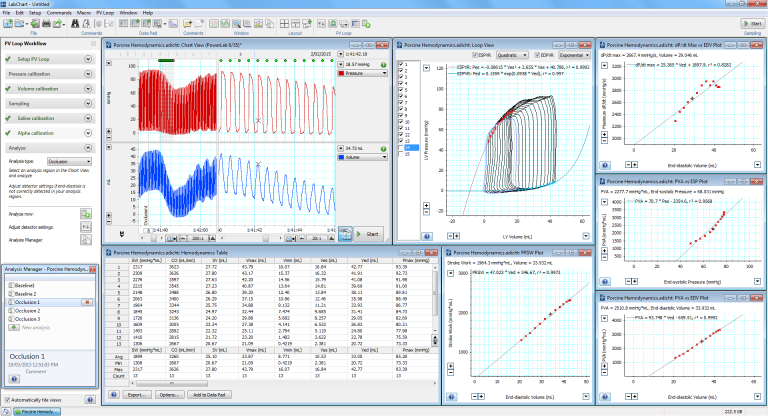
Changes in ventricular function for both normal and diseased conditions can be studied through analysis of ventricular pressure volume loops. The gold standard method for measuring direct, real-time complete cardiac function, particularly myocardial contractility measurements, PV loops can be generated by plotting real-time left or right ventricular pressure against ventricular volume during a complete cardiac cycle.
Providing instant cardiovascular function feedback based on morphology, position and timing of the loop, ventricular pressure volume is the only research technique that provides you full diastolic analysis and allows you to vary the load and measure beat-to-beat response of that changing load in cardiac performance.

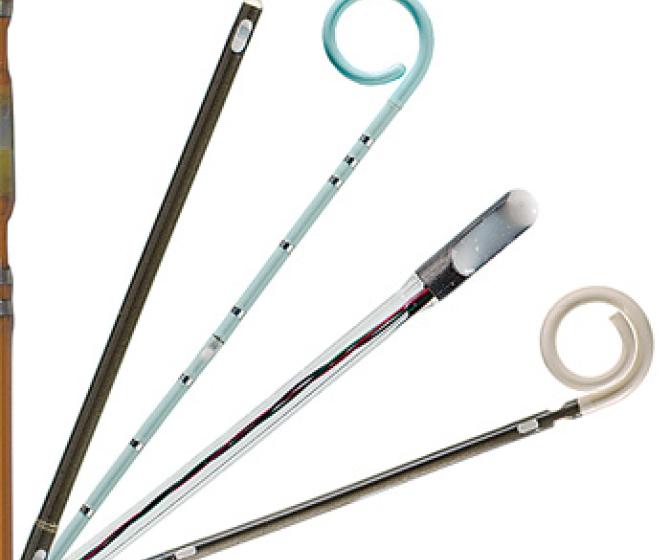
Gold standard
catheters
Begin with a
foundation system
and build from there
Mix and match
products for a
custom solution
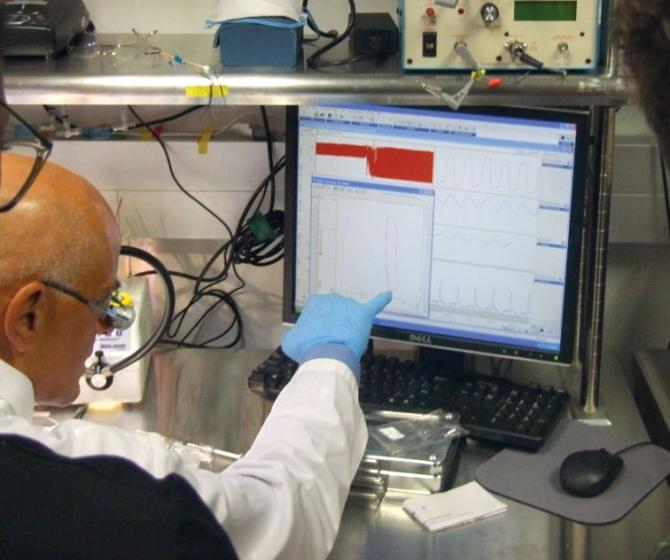
Integrate all
your data streams
in one place
We are proud to be exclusive global distributors of Millar Mikro-Tip® pressure catheters and associated hardware for ventricular pressure volume recording. By combining these highly sensitive, minimally invasive catheters with the power and integrity of PowerLab data acquisition and LabChart data analysis software, you can be sure you’ll get results you can trust.
In conjunction with our solutions shown below, any device with an analog output (+/- 10V) can be connected to a PowerLab data acquisition system for synchronization of events in LabChart. So you have even more flexibility and can integrate all your data streams in one place.
All of our hardware recommended for human use is backed by the appropriate safety certification standards. More information on safety standards.

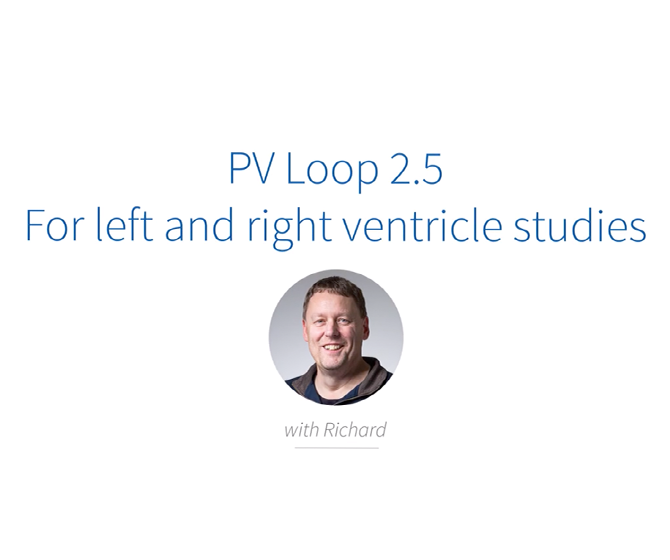
ADInstruments has been working alongside surgical expert Prof. René Remie, to produce a series of step-by-step instructional videos that demonstrate common Pressure-Volume and Invasive Pressure catheterization procedures.
Each of the 5 videos in the series follows a surgical catheterization procedure from start to finish, and include helpful techniques and tips throughout.
These videos are a unique and valuable resource for researchers performing cardiovascular research in animal models.
Complete Systems or Kits
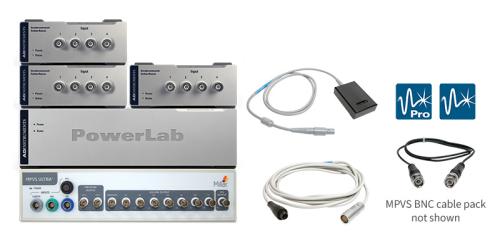
The Millar MPVS Ultra Foundation Systems are configured for measurement of ventricular pressure and volume in small through to large animal hearts, using an appropriate Millar PV catheter.
Related Components and Products
Data acquisition and analysis re-imagined. Make unique discoveries with unlimited freedom and flexibility.
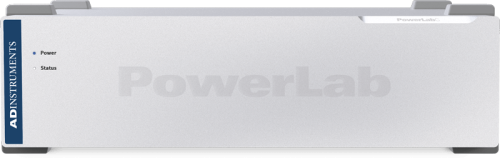
Engineered for precise, consistent, reliable data acquisition of a wide range of physiological signals. PowerLab gives you the reproducible data you need while meeting the strictest international standards.
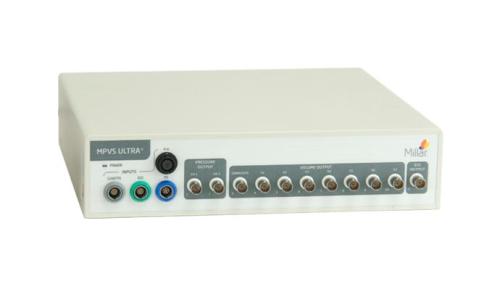
[feature_custom_description nid="9242"] Included in the MPVS Ultra Foundation System for the measurement of ventricular pressure and volume in small through to large animals. This unit provides analog outputs with BNC connectors for direct connection to a PowerLab 16/35 for two pressure channels and seven selectable volume channels. [/feature_custom_description]

[feature_custom_description nid="9242"] Included in the MPVS Ultra Single Segment Foundation Systems for the measurement of ventricular pressure and volume in mice and rats. This unit provides analog outputs with BNC connectors for direct connection to a PowerLab for two pressure signals and two volume outputs. [/feature_custom_description]
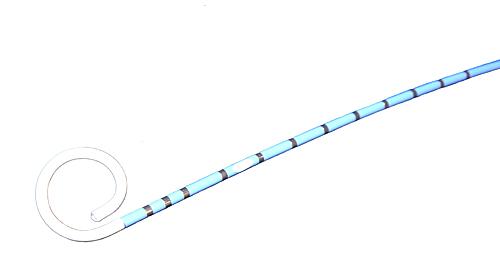
[feature_custom_description nid="9242"] Millar Mikro-Tip Ventri-Cath PV catheters are multi-segment pressure volume catheters for complete cardiac assessment in continuously beating, intact hearts of large animals (including pig, dog and sheep). Range of minimally invasive catheters available for direct insertion with no effect of normal heart function. [/feature_custom_description]
[feature_custom_description nid="9242"] Wide range of ultra-miniature, minimally-invasive Millar Mikro-Tip PV catheters. Designed for measuring left ventricular pressure and volume simultaneously and continuously from the intact beating hearts of mice. [/feature_custom_description]
[feature_custom_description nid="9242"] Wide range of Millar Mikro-Tip PV catheters for measuring continuous ventricular pressure and volume simultaneously from the intact beating hearts of rats.[/feature_custom_description]
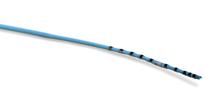
[feature_custom_description nid="9242"] Millar Mikro-Tip ultra-miniature PV catheters are multi-segmented pressure volume catheters designed for use for small animals (rabbits/cats). Range of revolutionary small sized catheters allows for direct insertion in the heart with virtually no effect on normal cardiac functioning. [/feature_custom_description]
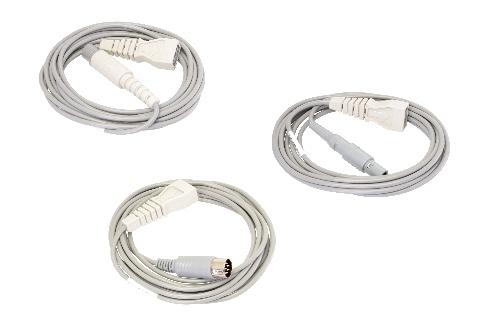
A complete range of Millar Mikro-Tip interface cables for connecting catheters to various system hardware
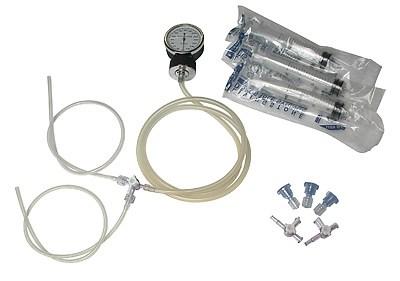
[feature_custom_description nid="9242"] Pressure gauge and accessories ideal for calibrating Millar Mikro-Tip Catheters as well as calibration for other cardiovascular systems as well. [/feature_custom_description][feature_custom_description nid="9304"] The pressure gauge and accessories are ideal for calibrating conventional fluid-filled pressure transducers. [/feature_custom_description]
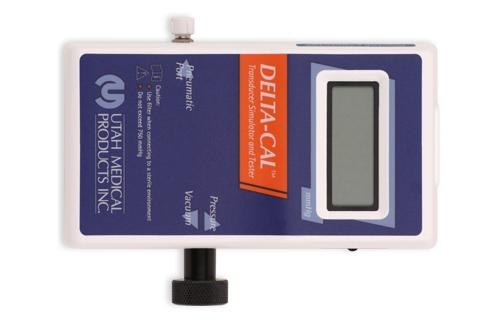
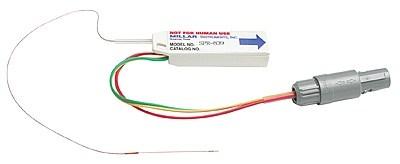
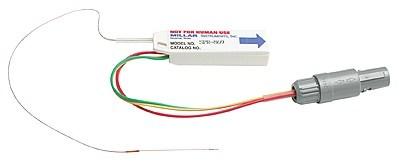
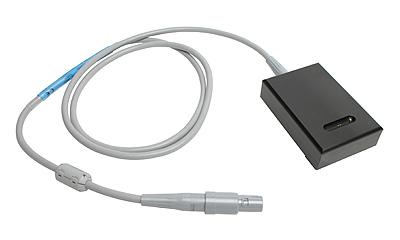
A hand-held pressure transducer simulator and tester, provides a quick and easy verification and/or calibration of pressure transducers.
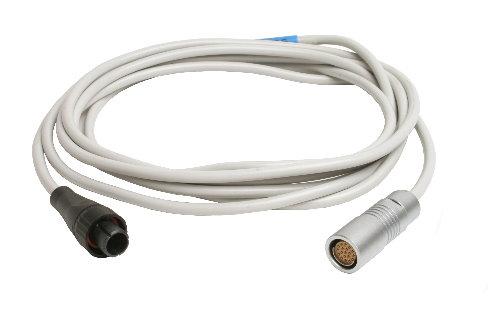
10ft extension cable designed to connect the MPVS Ultra Pressure Volume Unit (large and small animals) to the Ventri-Cath series of PV catheters for large animals.
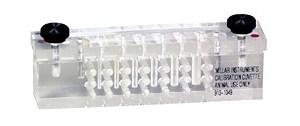
The Rho Calibration Cuvette is used to calibrate Pressure-Volume catheters using the MPVS Ultra Pressure-Volume unit from Millar (for large & small animals).
[feature_custom_description nid="9242"] Supplied with the MPVS Ultra Single Segment Foundation System and used to calibrate any of the mouse or rat single segment Millar Mikro-Tip PV catheters. [/feature_custom_description]

Flexible Data Acquisition
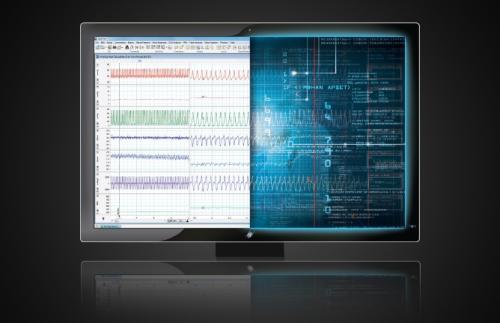
ADInstruments systems provide an integrated solution to advance life science research. With the combination of LabChart or LabChart Lightning analysis software and a PowerLab data acquisition unit, you have the flexibility to collect and synchronize a wide range of signals for analysis. We also offer a range of LabChart compatible solutions able to stream directly in LabChart.
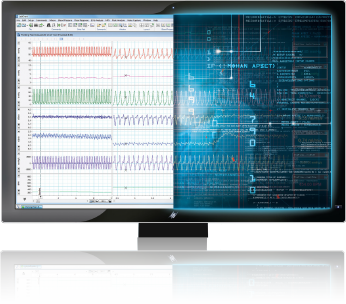
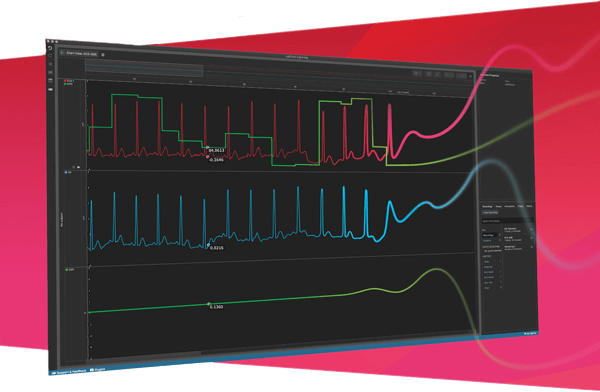
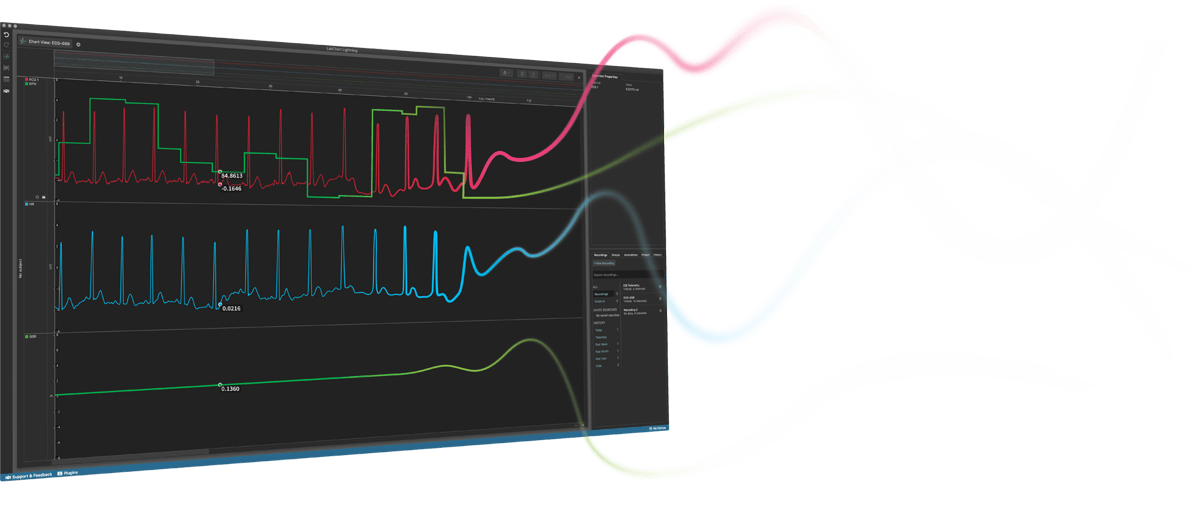
LabChart data analysis software creates a platform for all of your recording devices to work together, allowing you to acquire biological signals from multiple sources simultaneously and apply advanced calculations and plots as your experiment unfolds.
Data acquisition and analysis re-imagined. Make unique discoveries with unlimited freedom and flexibility.

High-performance data acquisition hardware designed for life science research. PowerLab is engineered for precise, consistent, reliable data acquisition, giving you the reproducible data you need while meeting the strictest international safety standards.
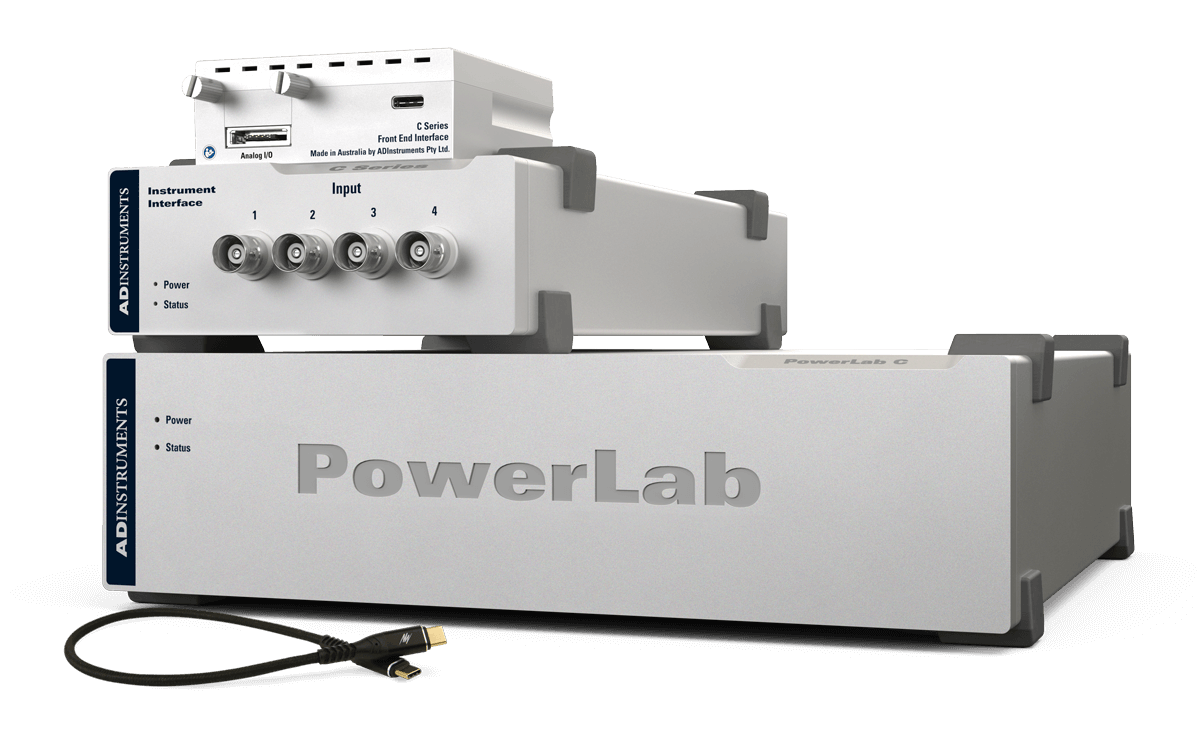
A modular data acquisition foundation system that provides unparalleled flexibility for researchers looking to invest in customizable, reliable solutions for both now, and in the future.
All your analysis in one place
LabChart software is designed specifically for life science data and provides up to 32 channels for data display and analysis options that are powerful and easy to use. With auto-recognition of ADI and LabChart Compatible hardware, multi-window views, one touch recording, simultaneous recording from multiple devices, specialized preconfigured settings, easy sharing options and an interface that can be customized to show only the features you want to use.
Features and Add-Ons
Additional acquisition and analysis options to support your Ventricular Pressure Volume + PV Loops analysis:

Data acquisition and analysis re-imagined.
Make unique discoveries with unlimited freedom and flexibility.