PV Loop
Pressure Volume (PV) Loop Analysis Software
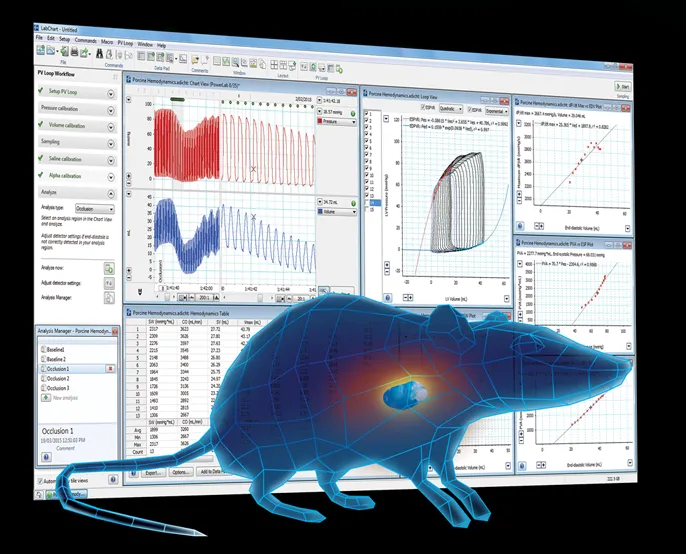
The PV Loop Analysis Software Module for LabChart is specifically designed for the analysis of in vivo ventricular pressure-volume data in small and large animals, or ex vivo, using working heart systems. Analyze ventricular pressure-volume baseline and occlusion data in realtime or post acquisition.
Download SoftwareFrequently purchased with PV Loop

Overview
PV Loop 2.6: For left and right ventricle studies.
LabChart’s latest version of the PV Loop Analysis Module includes new features designed to give you precise and accurate measurements of right and left ventricular contractility in rats, mice and other animals. In version 2.6, we have added two new algorithms for detecting end-systole in both right and left ventricular PV loops, and in situations where your PV loop may take on a more 'triangular' shape.
Ventricular pressure-volume (PV) loops are the gold standard method for measuring direct, real-time complete cardiac function, particularly myocardial contractility measurements. PV loops can be generated by plotting real-time ventricular pressure against ventricular volume during a complete cardiac cycle.
The PV Loop Analysis Module provides instant cardiovascular function feedback based on morphology, position and timing of the loop, supporting a range of cardiovascular research areas such as:
- Systolic and diastolic dysfunction
- Valvular heart disease
- Cardiomyopathy
- Pulmonary hypertension
- Cardiac failure
- Cardiovascular remodelling and vascular occlusions
- Transgenic manipulation
- Ischemia / Reperfusion studies
- Cardiac resynchronization therapy
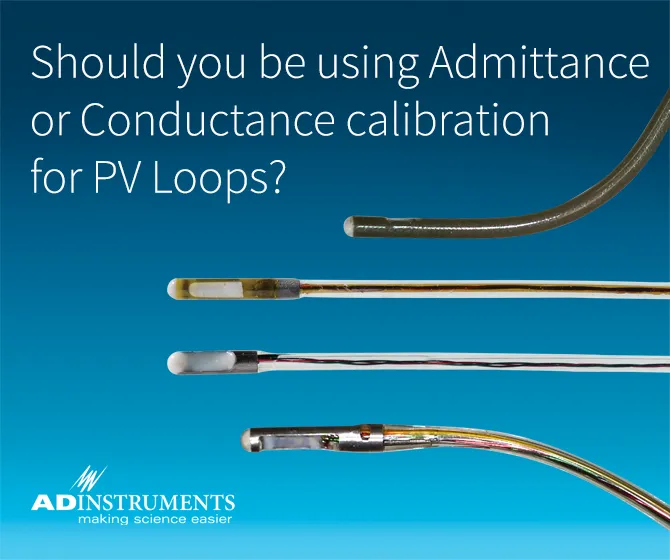
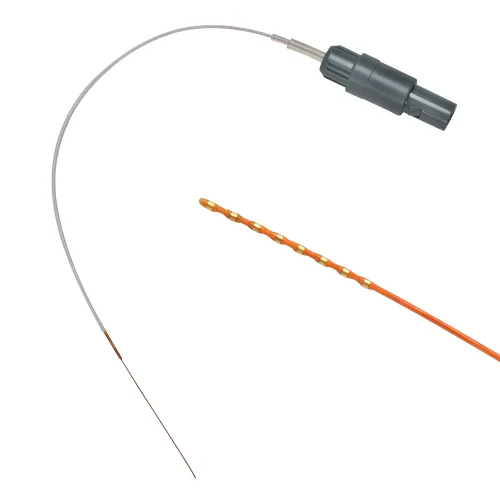
In combination with Millar’s extensive range of PV catheters - you have a highly sensitive, and minimally invasive way to measure and analyze changes in ventricular pressure-volume in small and large animals.
The PV Loop Analysis Software offers smart presets for different animals and streamlined workflows guiding you step-by-step from calibration through to analysis.
What's new in PV Loop 2.6?
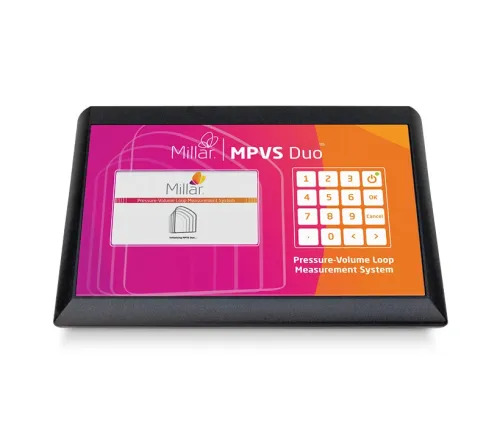
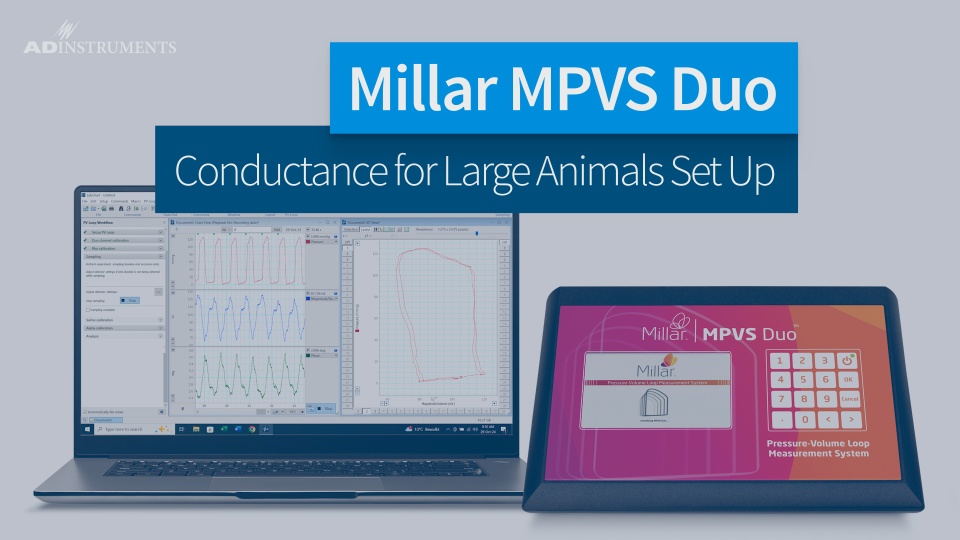
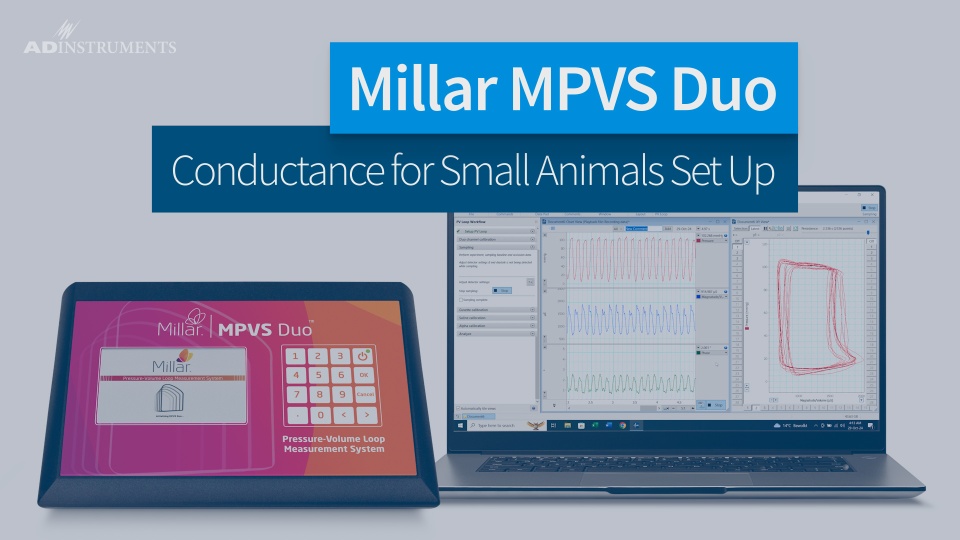
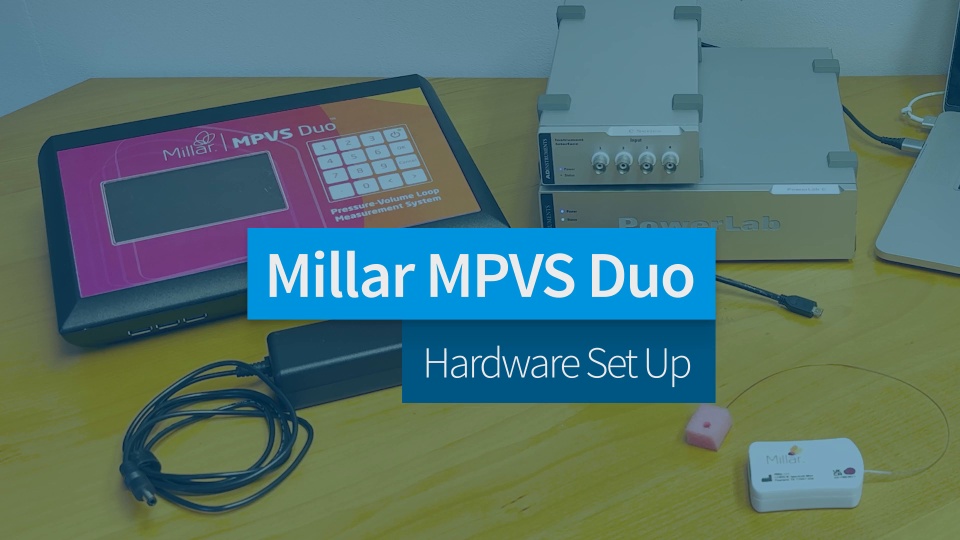
- Three new workflows have been added to PV Loop that support the MPVS Duo device. These new workflows are:
- The MPVS Duo workflows are streamlined using catheter selection and selectable segment lengths for known catheters.
- The existing Small Mammal and Large Mammal workflows have been renamed to reflect that they relate to the MPVS Ultra hardware device. The new names for these existing workflows are:
- MPVS Ultra - Small Mammal
- MPVS Ultra - Large Mammal
How to download PV Loop 2.6
The PV Loop Module is included as part of LabChart Pro or can be purchased separately. You can download the PV Loop Module using LabChart's Feature Manager, or on our website: PV Loop 2.6 for Windows.
System Requirements
PV Loop 2.6 is only compatible with LabChart v8.1.13 or later.
Related Resources
Surgical Instruction Video Series: Pressure Volume (PV) and Invasive Pressure - Step by step instructions for performing catheterization surgery on rodent models. Ideal for refining your technique or learning from scratch.
Importance of PV Catheter Calibration in Admittance and Conductance Systems - This article explores common shortcuts in volume calibration, and demonstrates how failing to perform the recommended calibration procedures can produce inaccurate results in both admittance and conductance PV systems.
Right Ventricle Catheterization Protocol - Improved method for the catheterization of the right ventricle in a rat model of pulmonary artery hypertension
Nature Protocol - Measurement of cardiac function using pressure volume conductance catheter technique in mice and rats
Best Practice Tips - Millar pressure and pressure volume catheters
Get the most out of your data by combining the PV-loop Analysis Module with some additional LabChart Modules such as:
ECG Analysis - automatically detects and reports PQRST onset, amplitude and intervals in real time, or after recording.
HRV - the R-wave threshold detector identifies and calculates ECG beat-to-beat interval variation to automatically categorize beats as normal, ectopic, or artifact (can also be used with arterial pulse signal).
Peak Analysis - provides automatic detection and analysis of multiple, non-overlapping signal peaks.
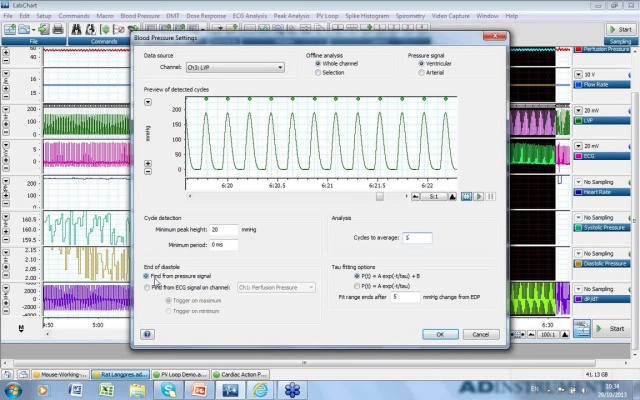
Blood Pressure - blood pressure graphing, monitoring & tracking software - automatically reporting cardiovascular parameters from arterial or ventricular pressure signals.
Cardiac Output - calculate the cardiac output of small animals, such as rats and mice, using the thermodilution technique.
Related
Products


Research Applications
Cardiovascular Hemodynamics
Working Heart
Cardiovascular Isolated Heart Systems
In Vitro Pharmacology + Isolated Tissue and Organs
Pulse and Plethysmography
Animal Tissue and Circulation
Isolated Organ
In Vitro Pharmacology + Isolated Tissue and Organs
Key Features
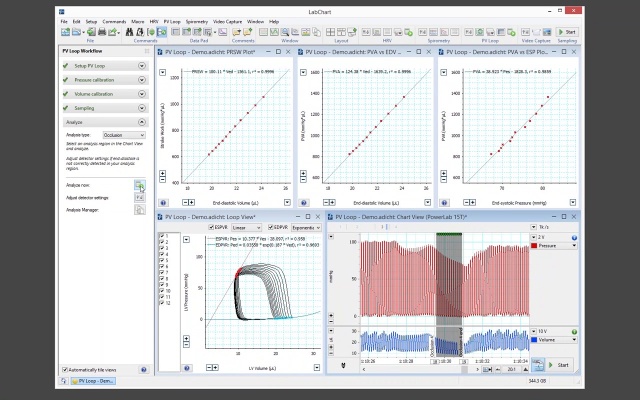
Loop View
- Choose which PV loops to analyze
- Contractility index using ESPVR slope (linear or quadratic)
- Compliance index using EDPVR slope (linear or exponential)
Industry Standard Parameters
- Stroke Work, Cardiac Output, Ejection Fraction, Tau Isovolumic Relaxation Constant, and many more
- Available from the Haemodynamics Table, with support for exporting to LabChart DataPad, or csv/text files for analysis
Analysis Plots
- Preload-recruitable stroke work (PRSW)
- Preload-recruitable maximum pressure change (dP/dt Max vs. EDV)
- Preload-recruitable maximum pressure change (dP/dt Max vs. EDV)
- Preload-recruitable total mechanical work (PVA vs. EDV)
- Afterload-dependent total mechanical work (PVA vs. ESP)
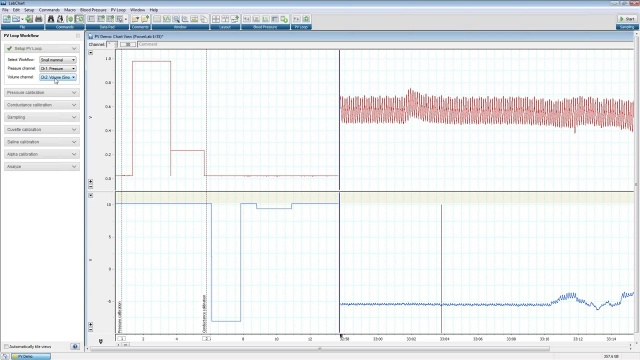
Streamlined Workflow
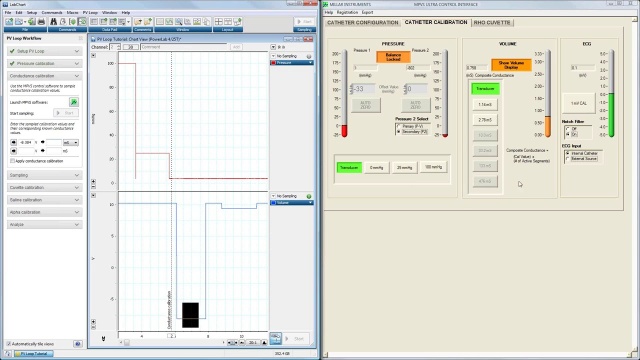
PV Loop guides your journey from pressure, conductance and volume calibration through to data analysis with supporting workflows for large animals, small animals, or echocardiogram users.
Intelligent Presets
Preset calibrations for small and large mammals enable you to follow best practices for recording and analyzing PV data using Millar catheters. The Workflow modes are optimized for use with the MPVS Duo Foundation System.
Powerful Volume Calibration
PV Loop also supports the analysis of multiple averaged cuvette well readings for accurate conductance to volume calibration.
Parallel Conductance Averaging
Correcting for parallel conductance from multiple saline bolus infusions doesn't need to be difficult. You can now generate a Ves Ved regression curve using averaged data to give you a reliable estimate.
Advanced Calibration
Alpha calibration is supported for researchers validating ventricular derived cardiac output with an independent measure, e.g., using a Transonic flow probe.
Support
Support Articles
Our Support Articles contain answers to common questions, how-tos, solutions, and documentation.
Training and Workshops
Maximize time and resources with our customized training services delivered at your facility, on your equipment, on your terms.
Related Videos


Details and Tech Specs
Technical
Compatibility
LabChart 8 for Windows | checkmark |
LabChart 8 for Mac | - |